Overslaan naar inhoud
Elke spuitgietfabriek heeft een koolstofprobleem — of je het nu meet of niet. Machinepersen verbruiken enorme hoeveelheden energie, thermoplastische korrels komen uit fossiele brandstoffen, en afvalpercentages stapelen zich stilletjes op op stortplaatsen. De vraag is niet of jouw spuitgieten operatie heeft een CO2-voetafdruk1, maar hoe groot het is en wat je realistisch gezien kunt doen om het te verkleinen.
- Het energieverbruik bij spuitgieten varieert van 1,5 tot 5,5 kWh per kg verwerkt polymeer
- Machineverwarming en -koelcycli zijn verantwoordelijk voor 60–70% van het totale energieverbruik van de fabriek
- Alleen al materiaalkeuze kan de ingebedde koolstof met 40–60% verminderen
- Regeneratieve machine-aandrijvingen recupereren tot 25% van de remenergie
- Gerecycled materiaal in een 30% mengsel vermindert de wieg-tot-poort-uitstoot met ongeveer een derde
Wat Draagt Bij aan de Koolstofvoetafdruk bij Spuitgieten?
Machine-energie is de grootste bijdrage aan de koolstofvoetafdruk, gevolgd door ingebedde koolstof in materialen en productieafval. Een uitgebreide spuitgietvorm levenscyclusanalyse toont aan dat machine-energie vaak domineert, maar voor bepaalde materialen overstijgt de koolstof in de grondstof al het andere.
Energieverbruik bij spuitgieten is niet constant — het piekt tijdens de plastificatie- en inspuitfasen, en daalt tijdens de houd- en koelfasen. De cilinderverwarmers op een typische hydraulische pers van 200 ton verbruiken continu 15–25 kW alleen al om de smelttemperatuur te handhaven, of de machine nu cycli draait of stil staat tussen de schoten. Die basisbelasting is de verborgen koolstofkost die de meeste fabrieken over het hoofd zien.
| Bron | Typisch Aandeel | Primaire drijfveren |
|---|---|---|
| Machine-energie (elektriciteit) | 40–60% | Cilinderverwarming, hydraulische pompen, klemkracht |
| Ingebouwde koolstof van grondstoffen | 25–40% | Polymeertype, virgin versus gerecycled materiaal |
| Hulpmaterieel | 10–15% | Drogers, koelers, transportbanden, robots |
| Afval- en restafvalverwerking | 5–10% | Afkeurpercentage, hermalingspraktijken, verwijderingsmethode |
| Facilitaire overheadkosten | 5–8% | Verlichting, HVAC, perslucht |
“Het verkorten van de cyclusduur vermindert direct de koolstofemissies per onderdeel bij spuitgieten.”Echt
Kortere cycli betekenen dat de machine minder energie per onderdeel besteedt aan klemmen, vasthouden en vatverwarming. Cyclusoptimalisatie via wetenschappelijk spuitgieten is een van de meest directe en kosteneffectieve CO2-reductiestrategieën die beschikbaar zijn.
“Overschakelen op volledig elektrische machines elimineert het grootste deel van de CO2-voetafdruk van spuitgieten.”Vals
Volledig elektrische machines verminderen het energieverbruik met 40–60%, maar de ingebedde koolstof in grondstoffen en hulpsystemen vormen nog steeds een aanzienlijk deel. Een holistische benadering die materialen, processen en infrastructuur aanpakt, is nodig voor een betekenisvolle koolstofreductie.
Hoe Meet Je Koolstofemissies bij Spuitgieten?
De standaardmethode om CO2-uitstoot bij spuitgieten te meten is een Levenscyclusanalyse2 (LCA) met wieg-tot-poort-bereik. Dit omvat materiaalproductie, transport en uw productieproces als praktisch startpunt, volgens de ISO 14040/14044-kaders.
Begin met meten Scope 1-emissies3 (aardgas ter plaatse voor drogers, heftruckbrandstof) en Scope 2-emissies (ingekochte elektriciteit die machines aandrijft). Je elektriciteitsrekening gedeeld door het productievolume geeft je een ruw specifiek energieverbruikscijfer. Vergelijk dat met de emissiefactor van je regionale elektriciteitsnet — een fabriek die dezelfde machines gebruikt in Noorwegen (0,02 kg CO2/kWh) en China (0,55 kg CO2/kWh) heeft drastisch verschillende voetafdrukken.
In de praktijk raden we aan om drie kernindicatoren maandelijks bij te houden: specifiek energieverbruik (kWh/kg), afvalpercentage (%) en ingebedde koolstof van materialen (kg CO2/kg polymeer). Deze drie getallen vertellen het grootste deel van het verhaal en geven duidelijke verbeterdoelen.
Welke Spuitgietmaterialen Hebben de Hoogste Koolstofvoetafdruk?
Niet alle kunststoffen zijn gelijk als het om CO2 gaat. De ingebedde CO2 van gangbare spuitgietmaterialen varieert aanzienlijk – van ongeveer 2 kg CO2/kg voor polypropyleen tot meer dan 9 kg CO2/kg voor koolstofvezelversterkt nylon. De grondstofbron (aardolie versus bio-based), de energie voor het polymerisatieproces en eventuele additieven of vulstoffen dragen allemaal bij.
| Materiaal | Ongeveer kg CO2/kg | Opmerkingen |
|---|---|---|
| PP (polypropyleen) | 1.8–2.5 | Laagste veelvoorkomende thermoplast; breed recyclebaar |
| PE (polyethyleen) | 1,8–2,8 | LDPE iets hoger dan HDPE vanwege procesenergie |
| PS (polystyreen) | 2.5–3.5 | Algemeen gebruik; EPS-schuim bevat extra blaasmiddelen |
| PVC (polyvinylchloride) | 2,0–3,0 | Lagere CO2-voetafdruk van grondstoffen, maar chloorverwerking voegt complexiteit toe |
| ABS | 3,0–4,0 | Drie-monomeer systeem verhoogt de verwerkingsenergie |
| PA6/PA66 (Nylon) | 5,0–7,0 | Energie-intensieve polymerisatie; caprolactamproductie is koolstofintensief |
| PC (polycarbonaat) | 6.0–8.0 | Fosgeen-gebaseerd proces; hoog energie- en chemisch verbruik |
| PEEK | 25–35 | Ultrahoge verwerkingstemperaturen vergroten de voetafdruk |
| CF-versterkt PA | 8,0–12,0 | Koolstofvezelproductie is extreem energie-intensief (~20 kg CO2/kg vezel) |
Wanneer we materiaalsubstituties evalueren in onze vestiging in Shanghai, kijken we verder dan het getal per kilogram. Een beter presterend polymeer kan u in staat stellen de wanddikte met 20% te verminderen, waardoor minder totaal materiaal wordt gebruikt en de hogere voetafdruk per kg wordt gecompenseerd. De functionele eenheid is belangrijk — vergelijk de voetafdruk per afgewerkt onderdeel, niet per kilogram hars.
Hoe Kan Machinekeuze Je Koolstofvoetafdruk Verkleinen?
De grootste hefboom die de meeste spuitgieters kunnen gebruiken, is de overstap van hydraulische naar volledig elektrische machines. Een typische hydraulische 200-ton pers verbruikt 30–50% meer energie dan een equivalente volledig elektrische machine die dezelfde onderdelen produceert. De reden is eenvoudig: hydraulische pompen draaien continu, genereren warmte die vervolgens door koelsystemen moet worden afgevoerd — een dubbele energiestraf.
Elektrische machines gebruiken servomotoren die alleen stroom verbruiken tijdens actieve bewegingen. Wanneer de sluiting vasthoudt, remt de motor en voert energie terug naar het systeem. Onafhankelijke studies tonen verbeteringen in specifiek energieverbruik van 40–60% bij het vervangen van oude hydraulische machines door moderne elektrische persen.
“Hotrunner-systemen verminderen de ecologische voetafdruk door het schroot van koude lopers te elimineren.”Echt
Heetkanaalsystemen elimineren de afvalstroom van koude kanalen volledig, wat zowel grondstoffen als de energie bespaart die nodig is om ze te vermalen en opnieuw te verwerken. Voor hoogvolume-gereedschap met meerdere holtes zijn de besparingen in materiaal en energie aanzienlijk.
“Het gebruik van 100% gerecycled plastic levert altijd een lagere CO2-voetafdruk op dan nieuw materiaal.”Vals
Hoewel mechanische recycling doorgaans 70–85% van de productie-energie bespaart, vereisen sommige gerecyclede stromen uitgebreide sortering, wassen en herverwerking die het netto-voordeel verminderen. Post-industrieel hergebruikt materiaal dat intern wordt gebruikt, heeft het beste koolstofprofiel.
Welke procesoptimalisatiestrategieën verlagen de CO2-uitstoot?
Cyclustijdoptimalisatie is de meest effectieve procesgerichte CO2-reductiestrategie. Wetenschappelijke spuitgiettechnieken die de minimaal haalbare koeltijd identificeren, verkorten cycli doorgaans met 10–25% zonder de kwaliteit van het onderdeel op te offeren. Elke seconde koeltijd die je elimineert, is een seconde waarin de machine geen energie verbruikt voor het vasthouden van de sluiting en het onderhoud van het vat.
Beheer van smelttemperatuur is een ander over het hoofd gezien gebied. Veel spuitgieters gebruiken vattemperaturen die 10–20°C hoger zijn dan nodig, omdat dit de instelling was die van de vorige klus werd overgenomen. Elke graad onnodige smelttemperatuur voegt ongeveer 1% toe aan het energieverbruik van het vat. Het instellen van de juiste smelttemperatuur voor het specifieke type vermindert de energie, verkort de koeltijd en verbetert vaak het uiterlijk van het onderdeel.
Hotrunner-systemen, wanneer goed gebalanceerd, verminderen materiaalafval door koude lopers volledig te elimineren. Conforme koelkanalen in mallen, mogelijk gemaakt door metaal 3D-printen, kunnen de cyclustijden met 20–40% verminderen, met proportionele energie- en koolstofreducties.
Hoe Beïnvloedt Gerecycled Inhoud de Koolstofvoetafdruk?
Het opnemen van post-industrieel of post-consumer gerecycled (PCR) materiaal is een van de meest effectieve strategieën voor koolstofreductie. Mechanische recycling van gangbare thermoplasten zoals PP, PE en PET gebruikt doorgaans 70–85% minder energie dan nieuwe productie, omdat u de energie-intensieve polymerisatiestap volledig overslaat. Voor een mengsel met 30% gerecycled materiaal in PP kunt u ongeveer een reductie van 25–30% in materiaalgerelateerde koolstofemissies verwachten.
De praktische uitdaging is het behouden van mechanische eigenschappen en kleurconsistentie. In onze fabriek gebruiken we routinematig PP met 20–30% post-industrieel hergebruikt materiaal voor niet-kritieke toepassingen zoals verpakkingsinserts en interne bevestigingsstukken. Voor zichtbare of structurele onderdelen valideren we gerecyclede mengsels via ons standaard kwaliteitscontroleproces voordat we overgaan op productievolumes.
Een waarschuwing: niet alle gerecyclede inhoud levert dezelfde koolstofvoordelen op. Als het gerecyclede materiaal extra sortering, wassen en opnieuw granuleren vereist die aanzienlijke energie verbruiken, neemt het netto voordeel af. Post-industrieel herverwerkt materiaal dat intern wordt gebruikt op het punt van opwekking heeft de laagste koolstofoverhead van alle gerecyclede stromen.
Welke Rol Speelt Fabrieksinfrastructuur bij Koolstofreductie?
Drukloze luchtsystemen, koelinfrastructuur en fabrieksverlichting zijn de drie grootste hefbomen voor koolstofreductie op fabrieksniveau. Drukloze luchtsystemen zijn berucht inefficiënt — doorgaans bereikt slechts 10–20% van de ingangsenergie het punt van gebruik. Elk luchtlek, elke ondergedimensioneerde leiding en elke onnodige leegloop draagt bij aan uw koolstofrekening. Een systematische audit van de drukloze lucht identificeert vaak een besparingspotentieel van 20–30% met goedkope oplossingen.
Koelinfrastructuur is een andere belangrijke factor. Centrale koelsystemen die meerdere machines bedienen, zijn efficiënter per ton koeling dan individuele vormtemperatuurregelaars, maar alleen als het distributieloop goed geïsoleerd is en de koelmachine correct is gedimensioneerd voor de werkelijke belasting.
Upgrades van verlichting naar LED, bewegingssensoren in magazijngebieden met weinig verkeer en frequentieregelaars op HVAC-motoren zijn niet glamoureus, maar samen zorgen ze doorgaans voor een besparing van 5–10% op de totale energie van de fabriek. Voor een fabriek met 47 spuitgietmachines vertegenwoordigt dat een aanzienlijke hoeveelheid vermeden CO2.
“LED-verlichting en frequentieregelaars op HVAC-motoren kunnen de overheadenergie van de fabriek met 5–10% verminderen.”Echt
Hoewel individuele besparingen bescheiden zijn, stapelen deze infrastructuurverbeteringen zich op in een grote fabriek. Voor een fabriek met 47 spuitgietmachines betekent een reductie van 5–10% in overhead honderden tonnen CO2 die jaarlijks worden vermeden.
“ISO 14001-certificering garandeert een lage CO2-voetafdruk voor een spuitgietfabriek.”Vals
ISO 14001 certificeert dat een milieumanagementsysteem bestaat en wordt gevolgd — het stelt geen specifieke koolstofprestatiedrempels vast. Een gecertificeerde fabriek kan nog steeds een hoge absolute voetafdruk hebben; certificering zorgt voor continue meting en verbetering, niet voor een bepaald prestatieniveau.
Hoe kunt u een routekaart voor koolstofreductie opstellen voor uw spuitgietoperatie?
Een driefasen routekaart is de meest praktische aanpak: basislijnmeting, procesoptimalisatie en vervolgens structurele investeringen. Fase 1 (0–6 maanden) begint met het installeren van submeters op grote machines, het bijhouden van het specifieke energieverbruik per pers en het kwantificeren van afvalpercentages. Snelle winsten zijn onder meer het uitschakelen van inactieve machines, het verlagen van de vatinsteltemperaturen en het repareren van persluchtlekken — deze kosten bijna niets en leveren doorgaans 5–15% energiebesparing op.
Fase 2 (6–18 maanden): Investeer in procesoptimalisatie. Implementeer wetenschappelijk spuitgieten om de cyclustijden op uw hoogste-volume gereedschappen te minimaliseren. Evalueer hotrunner-conversies voor multi-holtevormen die nog steeds koude lopers gebruiken. Begin met het kwalificeren van gerecyclede materiaalmengsels voor niet-kritieke onderdelen. Vervang de oudste, meest energieverslindende hydraulische machines door volledig elektrische alternatieven.
| Phase | Tijdlijn | Key Actions | Verwachte impact |
|---|---|---|---|
| 1 — Basis & Snelle Overwinningen | 0–6 maanden | Submetering, uitschakelen bij inactiviteit, reparatie van luchtlekken, temperatuuroptimalisatie | 5–15% energiebesparing |
| 2 — Procesoptimalisatie | 6–18 maanden | Wetenschappelijke spuitgiettechniek, warme kanalen, gerecyclede mengsels, machine-upgrades | 15–35% extra reductie |
| 3 — Structurele verandering | 18–36 maanden | Hernieuwbare energie, bio-based materialen, ISO 14001, volledige traceerbaarheid | 30–50% totale reductiedoelstelling |
Fase 3 (18–36 maanden): Structurele veranderingen. Evalueer zonne-energie op locatie of hernieuwbare energie sourcing guide. Onderzoek bio-gebaseerde polymeeralternatieven voor geschikte productlijnen. Implementeer volledige materiaaltraceerbaarheid om claims over gerecycled materiaal te ondersteunen. Overweeg ISO 14001-certificering als raamwerk voor continue milieuvooruitgang. Bij ZetarMold bieden onze ISO 14001- en ISO 45001-certificeringen de bestuursstructuur om onze milieuprestaties systematisch te volgen en te verbeteren.
Veelgestelde vragen over CO2-voetafdruk bij spuitgieten
Hoeveel CO2 produceert één spuitgietmachine per uur?
Een typische hydraulische spuitgietmachine van 200 ton verbruikt 25–40 kWh per uur. Met de wereldwijde gemiddelde netto-emissiefactor van ongeveer 0,46 kg CO2/kWh komt dat neer op 11,5–18,4 kg CO2 per uur. Een equivalente volledig elektrische machine zou ongeveer 5–9 kg CO2 per uur produceren.
Wat is de ecologische voetafdruk van één kilogram spuitgegoten PP-onderdelen?
Voor polypropyleen bedraagt de ingebedde koolstof in het hars ongeveer 1,8–2,5 kg CO2/kg. Door de verwerkingsenergie van ongeveer 1,5–3,0 kWh/kg toe te voegen, komt het totaal op ongeveer 2,5–4,0 kg CO2 per kg afgewerkte PP-onderdelen. Het gebruik van gerecycled PP kan dit met 25–40% verminderen.
Is spuitgieten koolstofintensiever dan andere productieprocessen?
Vergeleken met CNC-bewerking is spuitgieten doorgaans minder koolstofintensief per onderdeel bij volumes boven 1.000 eenheden, omdat materiaalverspilling veel lager is. Vergeleken met 3D-printen (FDM/SLA) is spuitgieten op schaal aanzienlijk efficiënter.
Kan hernieuwbare energie de CO2-uitstoot van spuitgieten volledig elimineren?
Hernieuwbare elektriciteit kan Scope 2-emissies elimineren, die typisch 40–60% van de CO2-voetafdruk van een faciliteit vertegenwoordigen. De ingebedde koolstof in polymeergrondstoffen (Scope 3 upstream) blijft echter bestaan, tenzij u overstapt op bio-based of volledig gerecyclede materialen.
Welk percentage van spuitgietafval kan worden gerecycled?
Thermoplastisch spuitgietafval — koude lopers, kortgeschoten en defecte onderdelen — is bijna 100% recyclebaar door mechanisch vermalen. De praktische limiet ligt meestal rond 20–30% geregenereerd materiaal in de voeding om consistente mechanische eigenschappen te behouden.
Hoe beïnvloedt wanddikte de ecologische voetafdruk bij spuitgietonderdelen?
Dikkere wanden vereisen meer materiaal per onderdeel en langere koeltijden. Het verminderen van de wanddikte met 20% kan de materiaalkoolstof per onderdeel met ongeveer 20% verminderen en de cyclusduur met 15–30%, met cumulatieve energiebesparingen.
Welke certificeringen helpen bij het verifiëren van CO2-reductie in spuitgieten?
ISO 14001 biedt het kader voor milieubeheer. ISO 14067 specificeert de methodologie voor het berekenen van de CO2-voetafdruk van producten. Voor materiaalspecifieke claims kan gerecycled gehalte worden geverifieerd via GRS (Global Recycled Standard) of SCS Recycled Content-certificering.
Heeft matrijzenontwerp invloed op de CO2-voetafdruk van de productie?
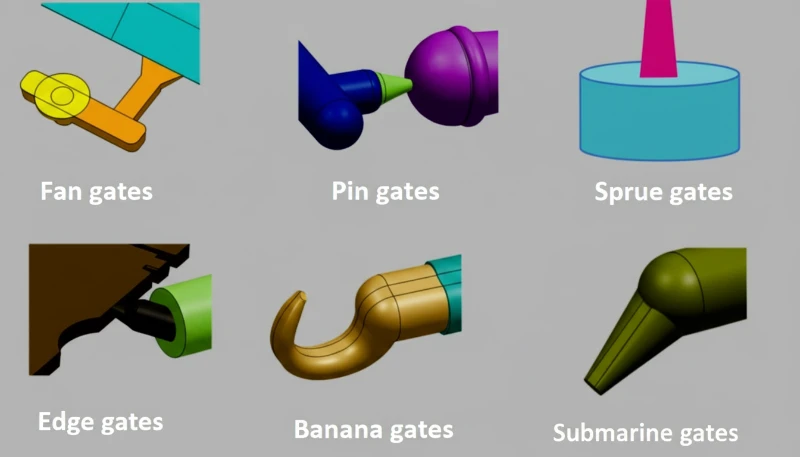
Matrijzenontwerp heeft een aanzienlijke impact op de CO2-voetafdruk per onderdeel. Heetkanaalsystemen elimineren afval van koude stromers. Conforme koelkanalen verkorten de cyclusduur met 20–40%. Geoptimaliseerde instroomlocaties verminderen de drukvereisten, waardoor een lagere machinekracht en energieverbruik mogelijk zijn.
Conclusie: Praktische stappen richting koolstofarm spuitgieten
Het verminderen van de CO2-voetafdruk van spuitgieten is geen eenmalig project — het is een discipline van continue verbetering die machinekeuze, procesparameters, materiaalkeuzes en fabrieksinfrastructuur omvat. Begin met meten: plaats submeters bij uw machines, volg het specifieke energieverbruik en bereken uw CO2-basislijn per onderdeel. Val vervolgens eerst de grootste hefbomen aan — machine-upgrades, optimalisatie van de cyclusduur en adoptie van gerecycled gehalte.
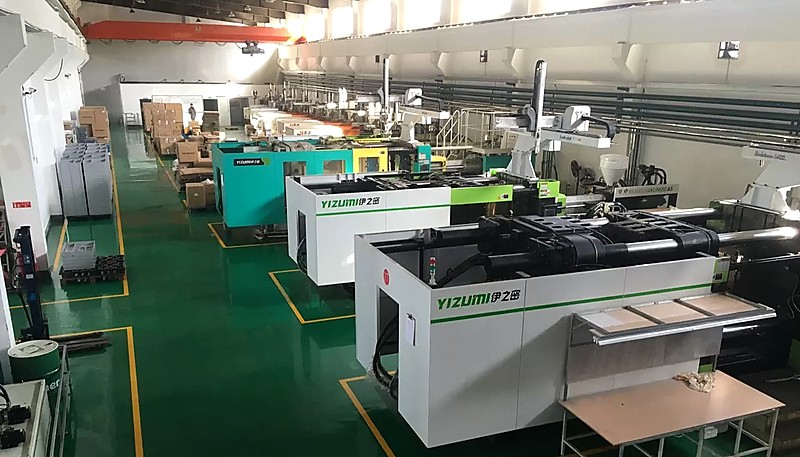
Bij ZetarMold bedienen we 47 spuitgietmachines van 90T tot 1850T in onze faciliteit in Shanghai, ondersteund door ISO 14001 en ISO 45001 milieubeheersystemen. Ons engineeringteam optimaliseert continu de cyclusparameters en evalueert opties voor gerecycled materiaal om onze milieu-impact te verminderen, terwijl we de kwaliteitsnormen handhaven die onze wereldwijde klanten verwachten. Als u op zoek bent naar een productiepartner die CO2-reductie serieus neemt, neem dan contact op met ons team om uw projectvereisten te bespreken.
-
CO2-voetafdruk: verwijst naar de totale hoeveelheid broeikasgassen die direct en indirect door een activiteit wordt geproduceerd, uitgedrukt in equivalente tonnen CO2. ↩
-
Levenscyclusanalyse: verwijst naar een methodologie voor het evalueren van de milieu-impact van een product, van grondstofwinning tot afdanking, volgens de ISO 14040/14044-raamwerken. ↩
-
Scope 1-emissies: verwijst naar directe broeikasgasemissies van bronnen die eigendom zijn van of worden beheerd door een organisatie, zoals brandstofverbranding ter plaatse in ketels of voertuigen. ↩