İçeriğe geç
Her enjeksiyon kalıplama fabrikasının bir karbon sorunu vardır — ölçseniz de ölçmeseniz de. Makine presleri muazzam enerji tüketir, termoplastik peletler fosil yakıtlardan gelir ve hurda oranları sessizce depolama alanlarında birikir. Sorun, sizin enjeksiyon kalıplama operasyonun bir Karbon Ayak İzi1, ancak ne kadar büyük olduğu ve onu küçültmek için gerçekçi olarak neler yapabileceğiniz.
- Enjeksiyon kalıplama enerji tüketimi, işlenen polimerin kg başına 1.5 ila 5.5 kWh arasında değişir
- Makine ısıtma ve soğutma döngüleri toplam tesis enerji kullanımının –70'ini oluşturur
- Malzeme seçimi tek başına gömülü karbonu –60 oranında azaltabilir
- Rejeneratif makine sürücüleri frenleme enerjisinin 'ine kadarını geri kazanır
- geri dönüştürülmüş içerikli karışım, başlangıçtan kapıya emisyonları kabaca üçte bir oranında düşürür
Enjeksiyon Kalıplamada Karbon Ayak İzine Neler Katkıda Bulunur?
Makine enerjisi, karbon ayak izine en büyük katkıyı yapan faktördür; bunu malzeme gömülü karbonu ve üretim atıkları izler. Kapsamlı bir enjeksiyon kalıbı yaşam döngüsü değerlendirmesi, makine enerjisinin genellikle baskın olduğunu, ancak belirli malzemeler için hammadde karbonunun her şeyi gölgede bıraktığını ortaya koyuyor.
Enjeksiyon kalıplamada enerji kullanımı sabit değildir — plastikleştirme ve enjeksiyon aşamalarında ani artışlar gösterir, tutma ve soğutma sırasında düşer. Tipik bir 200 tonluk hidrolik presin namlu ısıtıcıları, erime sıcaklığını korumak için makine döngüde olsun veya atışlar arasında boşta oturuyor olsun sürekli olarak 15–25 kW çeker. Bu temel yük, çoğu fabrikanın gözden kaçırdığı gizli karbon maliyetidir.
| Kaynak | Tipik Pay | Ana Etkenler |
|---|---|---|
| Makine enerjisi (elektrik) | 40–60% | Namlu ısıtma, hidrolik pompalar, kapama kuvveti |
| Hammadde gömülü karbonu | 25–40% | Polimer tipi, saf vs geri dönüştürülmüş içerik |
| Yardımcı ekipmanlar | 10–15% | Kurutucular, soğutucular, konveyörler, robotlar |
| Waste & scrap handling | 5–10% | Red oranı, geri öğütme uygulamaları, bertaraf yöntemi |
| Tesis genel giderleri | 5–8% | Aydınlatma, HVAC, basınçlı hava |
“Reducing cycle time directly reduces per-part carbon emissions in injection molding.”Doğru
Daha kısa döngüler, makinenin parça başına kilitlenme, tutma ve namlu ısıtma için daha az enerji harcaması anlamına gelir. Bilimsel kalıplama yoluyla döngü süresi optimizasyonu, mevcut en doğrudan ve uygun maliyetli karbon azaltma stratejilerinden biridir.
“Switching to all-electric machines eliminates most of the carbon footprint of injection molding.”Yanlış
Tamamen elektrikli makineler enerji tüketimini –60TP3T oranında azaltır, ancak ham madde içerdiği karbon ve yardımcı sistemler hala önemli bir paya sahiptir. Anlamlı bir karbon azaltımı için malzemeleri, süreçleri ve altyapıyı ele alan bütünsel bir yaklaşım gereklidir.
Enjeksiyon Kalıplamada Karbon Emisyonları Nasıl Ölçülür?
Enjeksiyon kalıplama karbon emisyonlarını ölçmenin standart yolu bir Yaşam Döngüsü Değerlendirmesi2 (LCA) kapsamı başlangıçtan kapıya. Bu, ISO 14040/14044 çerçevelerini izleyerek pratik bir başlangıç noktası olarak malzeme üretimi, taşıma ve üretim sürecinizi kapsar.
Ölçümle başlayın Kapsam 1 Emisyonları3 (kurum içi doğal gaz kurutucular, forklift yakıtı için) ve Kapsam 2 emisyonları (makineleri çalıştıran satın alınan elektrik). Elektrik faturanızı üretim hacmine bölerek kabaca özgül enerji tüketimi rakamı elde edersiniz. Bunu bölgesel şebeke emisyon faktörünüzle karşılaştırın — Norveç'te (0.02 kg CO2/kWh) ve Çin'de (0.55 kg CO2/kWh) aynı makineleri çalıştıran bir fabrikanın ayak izleri büyük farklılık gösterir.
Uygulamada, aylık olarak üç temel metriği takip etmenizi öneririz: spesifik enerji tüketimi (kWh/kg), fire oranı (%%) ve malzeme gömülü karbonu (kg CO2/kg polimer). Bu üç sayı size hikayenin çoğunu anlatır ve net iyileştirme hedefleri verir.
Hangi Enjeksiyon Kalıplama Malzemeleri En Yüksek Karbon Ayak İzine Sahiptir?
Karbon söz konusu olduğunda tüm plastikler eşit yaratılmamıştır. Yaygın enjeksiyon kalıplama reçinelerinin gömülü karbonu büyük ölçüde değişir — polipropilen için yaklaşık 2 kg CO2/kg'dan karbon elyaf takviyeli naylon için 9 kg CO2/kg'ın üzerine kadar. Hammadde kaynağı (petrol vs biyo-temelli), polimerizasyon işlem enerjisi ve herhangi bir katkı maddesi veya dolgu maddesi buna katkıda bulunur.
| Malzeme | Yaklaşık kg CO2/kg | Notlar |
|---|---|---|
| PP (Polipropilen) | 1.8–2.5 | En düşük ortak termoplastik; yaygın olarak geri dönüştürülebilir |
| PE (Polietilen) | 1.8–2.8 | LDPE, işlem enerjisi nedeniyle HDPE'den biraz daha yüksektir |
| PS (Polistiren) | 2.5–3.5 | Genel amaçlı; EPS köpüğün ek şişirme ajanları vardır |
| PVC (Polivinil Klorür) | 2.0–3.0 | Daha düşük hammadde karbonu, ancak klor işleme karmaşıklık ekler |
| ABS | 3.0–4.0 | Three-monomer system increases processing energy |
| PA6/PA66 (Nylon) | 5.0–7.0 | Energy-intensive polymerization; caprolactam production is carbon-heavy |
| PC (Polikarbonat) | 6.0–8.0 | Phosgene-based process; high energy and chemical inputs |
| PEEK | 25–35 | Ultra-high processing temperatures compound the footprint |
| CF-reinforced PA | 8.0–12.0 | Carbon fiber production is extremely energy-intensive (~20 kg CO2/kg fiber) |
When we evaluate material substitutions at our Shanghai facility, we look beyond the per-kilogram number. A higher-performing polymer might let you reduce wall thickness by 20%, using less total material and offsetting the higher per-kg footprint. The functional unit matters — compare footprint per finished part, not per kilogram of resin.
How Can Machine Selection Reduce Your Carbon Footprint?
The single biggest lever most molders can pull is switching from hydraulic to all-electric machines. A typical hydraulic 200-ton press consumes 30–50% more energy than an equivalent all-electric machine producing the same parts. The reason is straightforward: hydraulic pumps run continuously, generating heat that must then be removed by cooling systems — a double energy penalty.
All-electric machines use servo motors that only draw power during active movements. When the clamp is holding, the motor brakes and feeds energy back into the system. Independent studies show specific energy consumption improvements of 40–60% when replacing old hydraulic machines with modern electric presses.
“Hot runner systems reduce carbon footprint by eliminating cold runner scrap.”Doğru
Hot runners eliminate the cold runner waste stream entirely, saving both raw material and the energy needed to regrind and reprocess it. For high-volume multi-cavity tools, the material and energy savings are substantial.
“Using 100% recycled plastic always produces a lower carbon footprint than virgin material.”Yanlış
While mechanical recycling typically saves 70–85% of production energy, some recycled streams require extensive sorting, washing, and reprocessing that reduce the net benefit. Post-industrial regrind used in-house has the best carbon profile.
What Process Optimization Strategies Lower Carbon Emissions?
Cycle time optimization is the most effective process-level carbon reduction strategy. Scientific molding techniques that identify the minimum viable cooling time typically cut cycles by 10–25% without sacrificing part quality. Every second of cooling time you eliminate is a second where the machine is not consuming energy for clamp holding and barrel maintenance.
Melt temperature management is another overlooked area. Many molders run barrel temperatures 10–20°C higher than necessary because it was the setting inherited from the last job. Each degree of unnecessary melt temperature adds roughly 1% to barrel energy consumption. Dialing in the correct melt temperature for the specific grade reduces energy, shortens cooling time, and often improves part appearance.
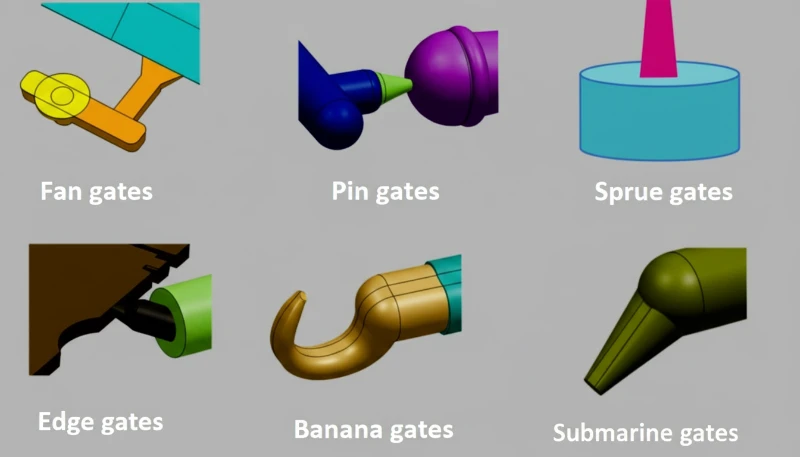
Hot runner systems, when properly balanced, reduce material waste by eliminating cold runners entirely. Conformal cooling channels in molds, enabled by metal 3D printing, can reduce cycle times by 20–40%, with proportional energy and carbon reductions.
How Does Recycled Content Affect the Carbon Footprint?
Incorporating post-industrial or post-consumer recycled (PCR) content is one of the most effective carbon reduction strategies. Mechanical recycling of common thermoplastics like PP, PE, and PET typically uses 70–85% less energy than virgin production, because you skip the energy-intensive polymerization step entirely. For a 30% recycled content blend in PP, you can expect roughly a 25–30% reduction in material-related carbon emissions.
The practical challenge is maintaining mechanical properties and color consistency. At our factory, we routinely run PP with 20–30% post-industrial regrind for non-critical applications like packaging inserts and internal brackets. For visible or structural parts, we validate recycled blends through our standard quality control process before committing to production volumes.
A note of caution: not all recycled content delivers equal carbon benefits. If the recycled material requires additional sorting, washing, and re-pelletizing steps that consume significant energy, the net benefit shrinks. Post-industrial regrind used in-house at the point of generation has the lowest carbon overhead of any recycled stream.
What Role Does Factory Infrastructure Play in Carbon Reduction?
Compressed air systems, cooling infrastructure, and facility lighting are the three biggest factory-level carbon reduction levers. Compressed air systems are notoriously inefficient — typically only 10–20% of input energy reaches the point of use. Every air leak, undersized pipe, and unnecessary blowdown adds to your carbon bill. A systematic compressed air audit often identifies 20–30% savings potential with low-cost fixes.
Cooling infrastructure is another major factor. Central chiller systems serving multiple machines are more efficient per ton of refrigeration than individual mold temperature controllers, but only if the distribution loop is properly insulated and the chiller is sized correctly for the actual load.
Lighting upgrades to LED, motion sensors in low-traffic warehouse areas, and variable-frequency drives on HVAC motors are not glamorous, but together they typically trim 5–10% off total facility energy. For a factory running 47 injection molding machines, that represents meaningful tonnage of CO2 avoided.
“LED lighting and variable-frequency drives on HVAC motors can reduce facility overhead energy by 5–10%.”Doğru
While individual savings are modest, these infrastructure improvements compound across a large factory. For a facility with 47 injection molding machines, 5–10% overhead reduction translates to hundreds of tonnes of CO2 avoided annually.
“ISO 14001 certification guarantees a low carbon footprint for a molding factory.”Yanlış
ISO 14001 certifies that an environmental management system exists and is followed — it does not set specific carbon performance thresholds. A certified factory may still have a high absolute footprint; certification ensures continuous measurement and improvement, not a particular performance level.
How Can You Build a Carbon Reduction Roadmap for Your Molding Operation?
A three-phase roadmap is the most practical approach: baseline measurement, process optimization, then structural investment. Phase 1 (0–6 months) starts with installing sub-meters on major machines, tracking specific energy consumption by press, and quantifying scrap rates. Quick wins include shutting down idle machines, reducing barrel set temperatures, and fixing compressed air leaks — these cost almost nothing and typically deliver 5–15% energy savings.
Phase 2 (6–18 months): Invest in process optimization. Implement scientific molding to minimize cycle times on your highest-volume tools. Evaluate hot runner conversions for multi-cavity molds still using cold runners. Begin qualifying recycled material blends for non-critical parts. Replace the oldest, most energy-hungry hydraulic machines with all-electric alternatives.
| Phase | Zaman Çizelgesi | Key Actions | Expected Impact |
|---|---|---|---|
| 1 — Baseline & Quick Wins | 0–6 months | Sub-metering, idle shutdown, air leak fixes, temperature optimization | 5–15% energy reduction |
| 2 — Process Optimization | 6–18 ay | Bilimsel kalıplama, sıcak kanallar, geri dönüştürülmüş karışımlar, makine yükseltmeleri | 15–35% ek azalma |
| 3 — Yapısal Değişiklik | 18–36 ay | Yenilenebilir enerji, biyo-temelli malzemeler, ISO 14001, tam izlenebilirlik | –50 toplam azaltma hedefi |
Faz 3 (18–36 ay): Yapısal değişiklikler. Şantiye içi güneş veya yenilenebilir enerjiyi değerlendirin sourcing guide. Uygun ürün hatları için biyo-bazlı polimer alternatiflerini araştırın. Geri dönüştürülmüş içerik iddialarını desteklemek için tam malzeme izlenebilirliği uygulayın. Sürekli çevresel iyileştirme için bir çerçeve olarak ISO 14001 sertifikasyonunu düşünün. ZetarMold'da, ISO 14001 ve ISO 45001 sertifikalarımız, çevresel performansımızı sistematik olarak izlemek ve iyileştirmek için yönetişim yapısını sağlar.
Enjeksiyon Kalıplamada Karbon Ayak İzi Hakkında Sıkça Sorulan Sorular
Bir enjeksiyon kalıplama makinesi saatte ne kadar CO2 üretir?
Tipik bir 200 tonluk hidrolik enjeksiyon kalıplama makinesi saatte 25–40 kWh enerji tüketir. Küresel ortalama şebeke emisyon faktörü olan yaklaşık 0,46 kg CO2/kWh kullanıldığında, bu saatte 11,5–18,4 kg CO2'ye karşılık gelir. Eşdeğer tam elektrikli bir makine ise yaklaşık saatte 5–9 kg CO2 üretir.
Bir kilogram enjeksiyon kalıplı PP parçanın karbon ayak izi nedir?
Polipropilen için reçinedeki somutlaşmış karbon yaklaşık 1,8–2,5 kg CO2/kg'dır. Yaklaşık 1,5–3,0 kWh/kg'lık işleme enerjisi eklendiğinde, bitmiş PP parçaların kg'ı başına toplam yaklaşık 2,5–4,0 kg CO2'ye ulaşılır. Geri dönüştürülmüş PP kullanmak bunu –40 oranında azaltabilir.
Enjeksiyon kalıplama diğer üretim süreçlerinden daha karbon yoğun mudur?
CNC işlemeye kıyasla, enjeksiyon kalıplama, 1.000 adet üzeri hacimlerde parça başına tipik olarak daha düşük karbon yoğunluğuna sahiptir çünkü malzeme atığı çok daha azdır. 3D baskıya (FDM/SLA) kıyasla, enjeksiyon kalıplama ölçekte önemli ölçüde daha verimlidir.
Yenilenebilir enerji enjeksiyon kalıplama karbon emisyonlarını tamamen ortadan kaldırabilir mi?
Yenilenebilir elektrik, tipik olarak bir tesisin karbon ayak izinin –60'ını temsil eden Kapsam 2 emisyonlarını ortadan kaldırabilir. Ancak, biyo-temelli veya tamamen geri dönüştürülmüş malzemelere geçmediğiniz sürece polimer hammaddelerindeki gömülü karbon (Kapsam 3 yukarı akış) kalır.
Enjeksiyon kalıplama atığının yüzde kaçı geri dönüştürülebilir?
Termoplastik enjeksiyon kalıplama atıkları — soğuk kanallar, eksik dolumlar ve kusurlu parçalar — mekanik yeniden öğütme yoluyla neredeyse 0 geri dönüştürülebilir. Pratik sınır, tutarlı mekanik özellikleri korumak için genellikle besleme karışımında –30 yeniden öğütülmüş içerik civarındadır.
Enjeksiyon kalıplı parçalarda duvar kalınlığı karbon ayak izini nasıl etkiler?
Daha kalın duvarlar parça başına daha fazla malzeme ve daha uzun soğutma süreleri gerektirir. Duvar kalınlığını azaltmak, parça başına malzeme karbonunu yaklaşık ve döngü süresini –30 oranında kesebilir, bu da bileşik enerji tasarrufları sağlar.
Enjeksiyon kalıplamada karbon azaltımını doğrulamaya yardımcı olan sertifikalar nelerdir?
ISO 14001 çevre yönetimi çerçevesini sağlar. ISO 14067 ürün karbon ayak izlerini hesaplama metodolojisini belirtir. Malzemeye özgü iddialar için, geri dönüştürülmüş içerik GRS (Küresel Geri Dönüştürülmüş Standart) veya SCS Geri Dönüştürülmüş İçerik sertifikasyonu ile doğrulanabilir.
Kalıp tasarımı üretimin karbon ayak izini etkiler mi?
Kalıp tasarımı, parça başına karbon ayak izi üzerinde önemli bir etkiye sahiptir. Sıcak dağıtıcı sistemleri soğuk dağıtıcı atığını ortadan kaldırır. Konformal soğutma kanalları döngü sürelerini –40 oranında azaltır. Optimize edilmiş geçit konumları basınç gereksinimlerini azaltarak daha düşük makine tonajı ve enerji kullanımına olanak tanır.
Sonuç: Daha Düşük Karbonlu Enjeksiyon Kalıplamaya Yönelik Pratik Adımlar
Enjeksiyon kalıplamanın karbon ayak izini azaltmak tek bir proje değildir — makine seçiminden, proses parametrelerinden, malzeme seçimlerinden ve fabrika altyapısına kadar uzanan sürekli bir iyileştirme disiplinidir. Ölçümle başlayın: makinelerinizi alt sayaçlarla takip edin, spesifik enerji tüketimini izleyin ve parça başına karbon baz çizginizi hesaplayın. Ardından önce en büyük kaldıraçlara saldırın — makine yükseltmeleri, döngü süresi optimizasyonu ve geri dönüştürülmüş içerik benimseme.
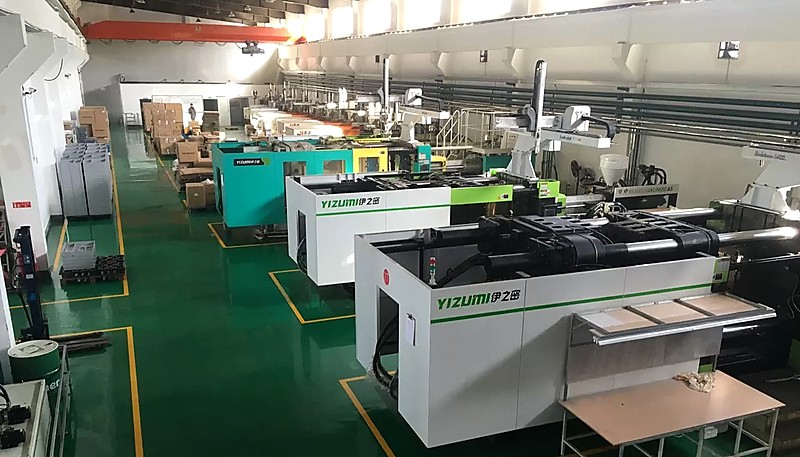
ZetarMold'da, Şanghay tesisimizde 90T ila 1850T arasında değişen 47 enjeksiyon kalıplama makinesi işletiyoruz ve bunlar ISO 14001 ve ISO 45001 çevre yönetim sistemleri ile desteklenmektedir. Mühendislik ekibimiz, küresel müşterilerimizin beklediği kalite standartlarını korurken çevresel etkimizi azaltmak için döngü parametrelerini sürekli optimize ediyor ve geri dönüştürülmüş malzeme seçeneklerini değerlendiriyor. Karbon azaltımını ciddiye alan bir üretim ortağı arıyorsanız, proje gereksinimlerinizi görüşmek üzere ekibimizle iletişime geçin.
-
Karbon Ayak İzi: bir faaliyet tarafından doğrudan ve dolaylı olarak üretilen toplam sera gazı miktarını ifade eder ve eşdeğer CO2 tonu cinsinden ifade edilir. ↩
-
Yaşam Döngüsü Değerlendirmesi: ISO 14040/14044 çerçevelerini izleyerek, bir ürünün hammadde çıkarımından bertarafına kadar olan çevresel etkilerini değerlendirmeye yönelik bir metodolojiyi ifade eder. ↩
-
Kapsam 1 Emisyonları: bir kuruluşun sahip olduğu veya kontrol ettiği kaynaklardan (kazanlarda veya araçlarda şantiye içi yakıt yanması gibi) kaynaklanan doğrudan sera gazı emisyonlarını ifade eder. ↩