Saltar para o conteúdo
Todas as fábricas de moldagem por injeção têm um problema de carbono — quer o meçam ou não. As prensas consomem energia enorme, as péletes termoplásticas vêm de combustíveis fósseis, e as taxas de desperdício acumulam-se silenciosamente em aterros. A questão não é se a sua moldagem por injeção operação tem uma Pegada de Carbono1, mas quão grande ela é e o que pode realisticamente fazer para a reduzir.
- O consumo de energia na moldagem por injeção varia entre 1,5 e 5,5 kWh por kg de polímero processado
- Os ciclos de aquecimento e arrefecimento da máquina representam 60–70% do consumo total de energia da fábrica
- Apenas a seleção de material pode reduzir o carbono incorporado em 40–60%
- Os acionamentos regenerativos das máquinas recuperam até 25% da energia de travagem
- O conteúdo reciclado na mistura 30% reduz as emissões do berço ao portão em aproximadamente um terço
O Que Contribui para a Pegada de Carbono na Moldagem por Injeção?
A energia da máquina é o maior contribuidor para a pegada de carbono, seguida do carbono incorporado no material e dos resíduos de produção. Uma molde de injeção a avaliação do ciclo de vida revela que a energia da máquina frequentemente domina, mas para certos materiais, o carbono da matéria-prima sobrepõe-se a tudo o resto.
O uso de energia na moldagem por injeção não é constante — atinge picos durante as fases de plastificação e injeção, desce durante a manutenção e o arrefecimento. Os aquecedores do cilindro numa prensa hidráulica típica de 200 toneladas consomem 15–25 kW continuamente apenas para manter a temperatura de fusão, quer a máquina esteja a ciclar ou parada entre disparos. Essa carga de base é o custo de carbono oculto que a maioria das fábricas ignora.
| Fonte | Participação típica | Motores Primários |
|---|---|---|
| Energia da máquina (eletricidade) | 40–60% | Aquecimento do cilindro, bombas hidráulicas, força de fecho |
| Carbono incorporado na matéria-prima | 25–40% | Tipo de polímero, conteúdo virgem vs reciclado |
| Equipamento auxiliar | 10–15% | Secadores, arrefecedores, transportadores, robôs |
| Manuseio de resíduos e sucata | 5–10% | Taxa de rejeição, práticas de retrituração, método de eliminação |
| Despesas gerais da instalação | 5–8% | Iluminação, AVAC, ar comprimido |
“Reduzir o tempo de ciclo reduz diretamente as emissões de carbono por peça na moldagem por injeção.”Verdadeiro
Ciclos mais curtos significam que a máquina gasta menos energia por peça em fecho, manutenção e aquecimento do cilindro. A otimização do tempo de ciclo através da moldagem científica é uma das estratégias de redução de carbono mais diretas e económicas disponíveis.
“Mudar para máquinas totalmente elétricas elimina a maior parte da pegada de carbono da moldagem por injeção.”Falso
As máquinas totalmente elétricas reduzem o consumo de energia em 40–60%, mas o carbono incorporado na matéria-prima e os sistemas auxiliares ainda representam uma parte significativa. Uma abordagem holística que aborde materiais, processos e infraestrutura é necessária para uma redução significativa de carbono.
Como Medir as Emissões de Carbono na Moldagem por Injeção?
A forma padrão de medir as emissões de carbono da moldagem por injeção é uma Avaliação do Ciclo de Vida2 (ACV) com âmbito do berço ao portão. Isto abrange a produção do material, o transporte e o seu processo de fabrico como ponto de partida prático, seguindo as normas ISO 14040/14044.
Comece por medir Emissões do Âmbito 13 (gás natural no local para secadores, combustível de empilhadores) e emissões do Âmbito 2 (eletricidade adquirida que alimenta as máquinas). A sua fatura de eletricidade dividida pelo volume de produção dá-lhe uma figura aproximada de consumo específico de energia. Cruze essa informação com o fator de emissão da rede elétrica da sua região — uma fábrica que opera as mesmas máquinas na Noruega (0,02 kg CO2/kWh) e na China (0,55 kg CO2/kWh) tem pegadas drasticamente diferentes.
Na prática, recomendamos monitorizar três métricas principais mensalmente: consumo específico de energia (kWh/kg), taxa de sucata (%) e carbono incorporado do material (kg CO2/kg de polímero). Estes três números contam-lhe a maior parte da história e dão-lhe objetivos claros de melhoria.
Quais Materiais de Moldagem por Injeção Têm a Maior Pegada de Carbono?
Nem todos os plásticos são iguais no que diz respeito ao carbono. O carbono incorporado das resinas comuns para moldagem por injeção varia drasticamente — desde aproximadamente 2 kg CO2/kg para o polipropileno até mais de 9 kg CO2/kg para o nylon reforçado com fibra de carbono. A origem da matéria-prima (petróleo vs. base biológica), a energia do processo de polimerização e quaisquer aditivos ou cargas contribuem todos.
| Material | Approx. kg CO2/kg | Notas |
|---|---|---|
| PP (Polipropileno) | 1.8–2.5 | Lowest common thermoplastic; widely recyclable |
| PE (Polietileno) | 1.8–2.8 | LDPE slightly higher than HDPE due to process energy |
| PS (Poliestireno) | 2.5–3.5 | General purpose; EPS foam has additional blowing agents |
| PVC (cloreto de polivinilo) | 2.0–3.0 | Lower feedstock carbon, but chlorine processing adds complexity |
| ABS | 3.0–4.0 | Three-monomer system increases processing energy |
| PA6/PA66 (Nylon) | 5.0–7.0 | Energy-intensive polymerization; caprolactam production is carbon-heavy |
| PC (Policarbonato) | 6.0–8.0 | Phosgene-based process; high energy and chemical inputs |
| PEEK | 25–35 | Ultra-high processing temperatures compound the footprint |
| CF-reinforced PA | 8.0–12.0 | Carbon fiber production is extremely energy-intensive (~20 kg CO2/kg fiber) |
When we evaluate material substitutions at our Shanghai facility, we look beyond the per-kilogram number. A higher-performing polymer might let you reduce wall thickness by 20%, using less total material and offsetting the higher per-kg footprint. The functional unit matters — compare footprint per finished part, not per kilogram of resin.
Como Pode a Seleção de Máquinas Reduzir a Sua Pegada de Carbono?
The single biggest lever most molders can pull is switching from hydraulic to all-electric machines. A typical hydraulic 200-ton press consumes 30–50% more energy than an equivalent all-electric machine producing the same parts. The reason is straightforward: hydraulic pumps run continuously, generating heat that must then be removed by cooling systems — a double energy penalty.
All-electric machines use servo motors that only draw power during active movements. When the clamp is holding, the motor brakes and feeds energy back into the system. Independent studies show specific energy consumption improvements of 40–60% when replacing old hydraulic machines with modern electric presses.
“Hot runner systems reduce carbon footprint by eliminating cold runner scrap.”Verdadeiro
Hot runners eliminate the cold runner waste stream entirely, saving both raw material and the energy needed to regrind and reprocess it. For high-volume multi-cavity tools, the material and energy savings are substantial.
“Using 100% recycled plastic always produces a lower carbon footprint than virgin material.”Falso
While mechanical recycling typically saves 70–85% of production energy, some recycled streams require extensive sorting, washing, and reprocessing that reduce the net benefit. Post-industrial regrind used in-house has the best carbon profile.
Que Estratégias de Otimização de Processos Reduzem as Emissões de Carbono?
Cycle time optimization is the most effective process-level carbon reduction strategy. Scientific molding techniques that identify the minimum viable cooling time typically cut cycles by 10–25% without sacrificing part quality. Every second of cooling time you eliminate is a second where the machine is not consuming energy for clamp holding and barrel maintenance.
Melt temperature management is another overlooked area. Many molders run barrel temperatures 10–20°C higher than necessary because it was the setting inherited from the last job. Each degree of unnecessary melt temperature adds roughly 1% to barrel energy consumption. Dialing in the correct melt temperature for the specific grade reduces energy, shortens cooling time, and often improves part appearance.
Hot runner systems, when properly balanced, reduce material waste by eliminating cold runners entirely. Conformal cooling channels in molds, enabled by metal 3D printing, can reduce cycle times by 20–40%, with proportional energy and carbon reductions.
Como Afeta o Conteúdo Reciclado a Pegada de Carbono?
Incorporating post-industrial or post-consumer recycled (PCR) content is one of the most effective carbon reduction strategies. Mechanical recycling of common thermoplastics like PP, PE, and PET typically uses 70–85% less energy than virgin production, because you skip the energy-intensive polymerization step entirely. For a 30% recycled content blend in PP, you can expect roughly a 25–30% reduction in material-related carbon emissions.
The practical challenge is maintaining mechanical properties and color consistency. At our factory, we routinely run PP with 20–30% post-industrial regrind for non-critical applications like packaging inserts and internal brackets. For visible or structural parts, we validate recycled blends through our standard quality control process before committing to production volumes.
A note of caution: not all recycled content delivers equal carbon benefits. If the recycled material requires additional sorting, washing, and re-pelletizing steps that consume significant energy, the net benefit shrinks. Post-industrial regrind used in-house at the point of generation has the lowest carbon overhead of any recycled stream.
Que Papel Desempenha a Infraestrutura da Fábrica na Redução de Carbono?
Compressed air systems, cooling infrastructure, and facility lighting are the three biggest factory-level carbon reduction levers. Compressed air systems are notoriously inefficient — typically only 10–20% of input energy reaches the point of use. Every air leak, undersized pipe, and unnecessary blowdown adds to your carbon bill. A systematic compressed air audit often identifies 20–30% savings potential with low-cost fixes.
Cooling infrastructure is another major factor. Central chiller systems serving multiple machines are more efficient per ton of refrigeration than individual mold temperature controllers, but only if the distribution loop is properly insulated and the chiller is sized correctly for the actual load.
Lighting upgrades to LED, motion sensors in low-traffic warehouse areas, and variable-frequency drives on HVAC motors are not glamorous, but together they typically trim 5–10% off total facility energy. For a factory running 47 injection molding machines, that represents meaningful tonnage of CO2 avoided.
“LED lighting and variable-frequency drives on HVAC motors can reduce facility overhead energy by 5–10%.”Verdadeiro
While individual savings are modest, these infrastructure improvements compound across a large factory. For a facility with 47 injection molding machines, 5–10% overhead reduction translates to hundreds of tonnes of CO2 avoided annually.
“ISO 14001 certification guarantees a low carbon footprint for a molding factory.”Falso
ISO 14001 certifies that an environmental management system exists and is followed — it does not set specific carbon performance thresholds. A certified factory may still have a high absolute footprint; certification ensures continuous measurement and improvement, not a particular performance level.
Como Pode Construir um Roteiro de Redução de Carbono para a Sua Operação de Moldagem?
A three-phase roadmap is the most practical approach: baseline measurement, process optimization, then structural investment. Phase 1 (0–6 months) starts with installing sub-meters on major machines, tracking specific energy consumption by press, and quantifying scrap rates. Quick wins include shutting down idle machines, reducing barrel set temperatures, and fixing compressed air leaks — these cost almost nothing and typically deliver 5–15% energy savings.
Phase 2 (6–18 months): Invest in process optimization. Implement scientific molding to minimize cycle times on your highest-volume tools. Evaluate hot runner conversions for multi-cavity molds still using cold runners. Begin qualifying recycled material blends for non-critical parts. Replace the oldest, most energy-hungry hydraulic machines with all-electric alternatives.
| Phase | Linha do tempo | Key Actions | Expected Impact |
|---|---|---|---|
| 1 — Baseline & Quick Wins | 0–6 months | Sub-metering, idle shutdown, air leak fixes, temperature optimization | 5–15% energy reduction |
| 2 — Otimização do Processo | 6–18 meses | Moldagem científica, canais quentes, misturas recicladas, atualizações de máquinas | 15–35% de redução adicional |
| 3 — Alteração Estrutural | 18–36 meses | Energia renovável, materiais de base biológica, ISO 14001, rastreabilidade total | Meta de redução total de 30–50% |
Fase 3 (18–36 meses): Alterações estruturais. Avaliar energia solar no local ou energia renovável sourcing guide. Investigue alternativas de polímeros de base biológica para linhas de produtos apropriadas. Implemente rastreabilidade total de materiais para apoiar alegações de conteúdo reciclado. Considere a certificação ISO 14001 como um quadro para melhoria ambiental contínua. Na ZetarMold, as nossas certificações ISO 14001 e ISO 45001 fornecem a estrutura de governança para monitorizar e melhorar o nosso desempenho ambiental de forma sistemática.
Perguntas Frequentes sobre Pegada de Carbono na Moldagem por Injeção
Quanto CO2 produz uma máquina de moldagem por injeção por hora?
Uma típica máquina de moldagem por injeção hidráulica de 200 toneladas consome 25–40 kWh por hora. Usando o fator médio global de emissão da rede de aproximadamente 0,46 kg CO2/kWh, isso traduz-se em 11,5–18,4 kg CO2 por hora. Uma máquina totalmente elétrica equivalente produziria aproximadamente 5–9 kg CO2 por hora.
Qual é a pegada de carbono de um quilograma de peças de PP moldadas por injeção?
Para o polipropileno, o carbono incorporado na resina é aproximadamente 1,8–2,5 kg CO2/kg. Adicionar a energia de processamento de aproximadamente 1,5–3,0 kWh/kg traz o total para aproximadamente 2,5–4,0 kg CO2 por kg de peças de PP acabadas. Usar PP reciclado pode reduzir isto em 25–40%.
A moldagem por injeção é mais intensiva em carbono do que outros processos de fabrico?
Comparada com a usinagem CNC, a moldagem por injeção é tipicamente menos intensiva em carbono por peça em volumes acima de 1.000 unidades porque o desperdício de material é muito menor. Comparada com a impressão 3D (FDM/SLA), a moldagem por injeção é dramaticamente mais eficiente em escala.
A energia renovável pode eliminar totalmente as emissões de carbono da moldagem por injeção?
A eletricidade renovável pode eliminar as emissões do Âmbito 2, que tipicamente representam 40–60% da pegada de carbono de uma instalação. No entanto, o carbono incorporado nas matérias-primas poliméricas (Âmbito 3 a montante) permanece, a menos que se mude para materiais de base biológica ou totalmente reciclados.
Que percentagem dos resíduos da moldagem por injeção pode ser reciclada?
Os resíduos da moldagem por injeção de termoplásticos — canais frios, peças incompletas e peças defeituosas — são quase 100% recicláveis através da moagem mecânica. O limite prático é geralmente cerca de 20–30% de conteúdo de material moído na mistura de alimentação para manter propriedades mecânicas consistentes.
Como é que a espessura da parede afeta a pegada de carbono em peças moldadas por injeção?
Paredes mais espessas requerem mais material por peça e tempos de arrefecimento mais longos. Reduzir a espessura da parede em 20% pode cortar o carbono do material por peça em aproximadamente 20% e o tempo de ciclo em 15–30%, com poupanças de energia compostas.
Que certificações ajudam a verificar a redução de carbono na moldagem por injeção?
A ISO 14001 fornece o quadro de gestão ambiental. A ISO 14067 especifica a metodologia para calcular as pegadas de carbono dos produtos. Para alegações específicas de materiais, o conteúdo reciclado pode ser verificado através da certificação GRS (Global Recycled Standard) ou SCS Recycled Content.
O design do molde impacta a pegada de carbono da produção?
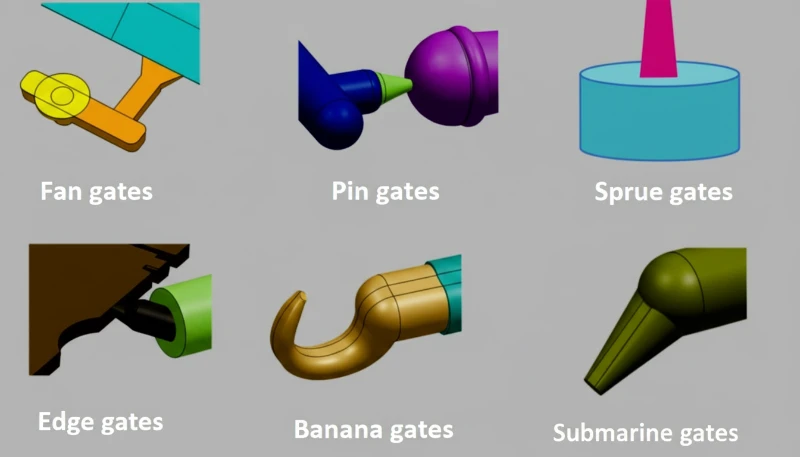
O design do molde tem um impacto significativo na pegada de carbono por peça. Os sistemas de canais quentes eliminam o desperdício de canais frios. Os canais de arrefecimento conformais reduzem os tempos de ciclo em 20–40%. As localizações de entrada otimizadas reduzem os requisitos de pressão, permitindo menor tonelagem da máquina e uso de energia.
Conclusão: Passos Práticos para uma Moldagem por Injeção com Menor Carbono
Reduzir a pegada de carbono da moldagem por injeção não é um projeto único — é uma disciplina de melhoria contínua que abrange seleção de máquinas, parâmetros do processo, escolhas de materiais e infraestrutura da fábrica. Comece com a medição: submeta as suas máquinas a medição, acompanhe o consumo específico de energia e calcule a sua linha de base de carbono por peça. Depois, ataque primeiro as maiores alavancas — atualizações de máquinas, otimização do tempo de ciclo e adoção de conteúdo reciclado.
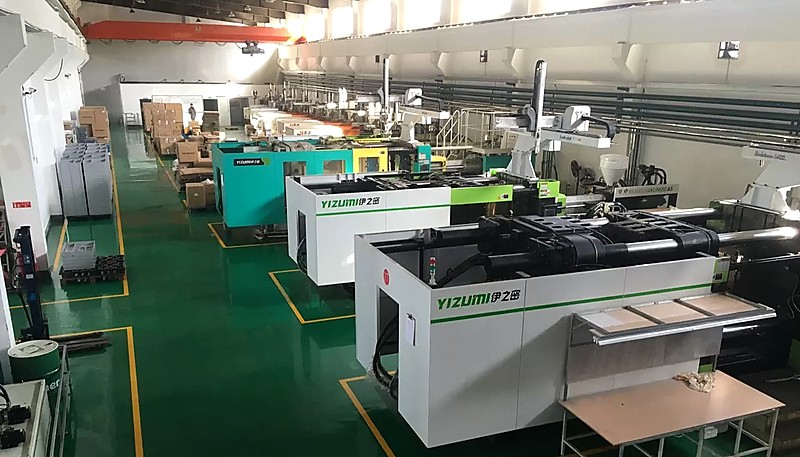
Na ZetarMold, operamos 47 máquinas de moldagem por injeção, desde 90T até 1850T, na nossa instalação de Xangai, apoiadas pelos sistemas de gestão ambiental ISO 14001 e ISO 45001. A nossa equipa de engenharia otimiza continuamente os parâmetros do ciclo e avalia opções de materiais reciclados para reduzir o nosso impacto ambiental, mantendo os padrões de qualidade que os nossos clientes globais esperam. Se procura um parceiro de fabrico que leva a sério a redução de carbono, contacte a nossa equipa para discutir os requisitos do seu projeto.
-
Pegada de Carbono: refere-se à quantidade total de gases com efeito de estufa produzidos direta e indiretamente por uma atividade, expressa em toneladas equivalentes de CO2. ↩
-
Avaliação do Ciclo de Vida: refere-se a uma metodologia para avaliar os impactos ambientais de um produto desde a extração de matéria-prima até à eliminação, seguindo os quadros ISO 14040/14044. ↩
-
Emissões do Âmbito 1: refere-se às emissões diretas de gases com efeito de estufa provenientes de fontes detidas ou controladas por uma organização, como a combustão de combustível no local em caldeiras ou veículos. ↩