Overslaan naar inhoud
Je hebt net 3.000 onderdelen afgekeurd vanwege sink mark1is de inspecteur te laat ontdekt. Het echte probleem? Niemand keek naar wat er gebeurde in de matrijs holte tijdens het inspuiten. Holtedrukbewaking geeft u een real-time venster op de vulfase, aandrukfase en houdfase — zodat u defecten bij de machine ontdekt, niet bij de verzendplaats. Dit artikel legt uit hoe holtedruksensoren werken, wat de drukkrommen u vertellen, en wanneer de investering daadwerkelijk rendeert.
- Holtedruksensoren meten wat er real-time in de matrijs gebeurt
- Drukkrommen tonen vul-, aandruk- en koelgedrag dat van buitenaf onzichtbaar is
- Wetenschappelijke spuitgiettechniek gebruikt holtedata om herhaalbare, ontkoppelde processen op te bouwen
- ROI is het sterkst voor onderdelen met nauwe toleranties, grote series of medische kwaliteit
- Sensorkeuze en plaatsing zijn even cruciaal als het bewakingssysteem zelf
Wat Is Holtedrukbewaking in Spuitgieten?
Holtedrukbewaking is het gebruik van ingebedde sensoren in de matrijs holte om real-time smeltdruk te meten tijdens elke injectiecyclus. Het geeft je een direct beeld van wat het plastic ervaart tijdens het vullen, aandrukken en houden — iets wat machinezijde druk je niet kan vertellen.
De praktijk omvat het inbouwen van druksensoren in een spuitgietvorm2 om smeltdruk op specifieke locaties te meten tijdens elke cyclus. In tegenstelling tot machinezijde druksensoren die alleen vertellen wat de schroef doet, vertellen holtesensoren wat de kunststof daadwerkelijk ervaart in de holte. Dat onderscheid is belangrijk. Heel belangrijk.
In een conventionele opstelling past uw proces technicus inspuitsnelheid, aandrukdruk en houdtijd aan op basis van externe observaties — onvolledige injecties, uitstulpingen, zinkplekken, dimensionale rapporten. Tegen de tijd dat u het defect ziet, is de cyclus al voorbij. Holtedrukbewaking verschuift de feedbacklus van post-mortem inspectie naar detectie tijdens het proces.
Het concept is ontstaan in de wetenschappelijke spuitgietmethodologie, waarbij het doel is om de vier fasen te ontkoppelen spuitgieten — vullen, aandrukken, houden en afkoelen — en elk onafhankelijk beheersen met behulp van data, niet intuïtie. Holtedruk is de meest informatieve variabele in die methodologie.
| Parameter | Machinedruk | Holtedruk |
|---|---|---|
| Meetlocatie | Schroef / spuitmond | In de holte |
| Wat het je vertelt | Machine-inspanning | Materiaalgedrag |
| Detecteert onvolledige injecties? | Indirect | Direct, in realtime |
| Detecteert krimpzakjes? | Geen | Ja — aandruktekort zichtbaar |
| Beïnvloed door matrijskonstructie? | Geen | Ja — de geometrie van de aanvoerleiding is belangrijk |
| Sensor kosten per matrijs | $0 (ingebouwd) | $500–$3.000 per sensor |
Waarom is Holtedruk Belangrijk voor Onderdeelkwaliteit?
Holtedruk is de enige variabele in de matrijs die rechtstreeks het onderdeelgewicht, de afmetingen en defectvorming tijdens de spuitgietcyclus beheerst. De meeste spuitgietdefecten ontstaan tijdens de vull- en aandrukkersfasen – en holtedruk is de enige variabele die beide direct meet. Wanneer je een krimpzakje, dimensionele afwijking of laslijnprobleem op het eindproduct ziet, was de oorzaak een drukgebeurtenis die seconden eerder in de holte plaatsvond.
Hier is een praktisch voorbeeld. Stel dat je een polycarbonaat behuizing spuitgiet met een nominale wand van 3 mm en een verstevigingsrib die een sectie van 5 mm dik creëert. Als de holtedruk op de locatie van de rib te snel daalt tijdens de aandrukfase, wordt het dikke gedeelte niet voldoende aangevuld. Resultaat: een zinkmerk dat de visuele inspectie niet doorstaat. Zonder holtedrukdata gokt je procesingenieur op aandrukkracht en -tijd. Met die data zien ze precies wanneer de druk daalt en passen ze het houdprofiel aan om dit te compenseren.
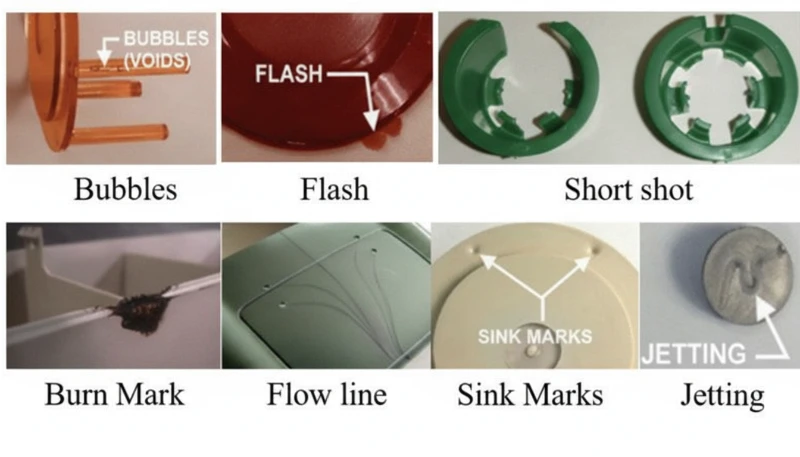
De vier defectcategorieën die holtedrukbewaking het meest effectief aanpakt zijn:
1. Korte schoten en onvolledige vulling. Als de drukkurve nooit de verwachte piek bereikt op de locatie van de eindvulsensor, is de holte niet volledig gevuld. Je ontdekt het in cyclus één – niet na een productierun van 500 onderdelen.
2. Zinkmarkeringen en holtes. Deze correleren direct met pakdrukafname. De drukcurve laat zien of de holte genoeg materiaal heeft ontvangen tijdens de houdfase om volumetrische krimp te compenseren.
3. Flits. Overmatige holtedruk – vooral wanneer deze boven de dichtkrachtgrens van de machine uitstijgt – is de voorbode van flits. De drukkurve waarschuwt je voordat flits op het onderdeel verschijnt.
4. Dimensionale variatie. Holtedruk tijdens de pakfase bepaalt direct het gewicht en de dimensies van het product. Studies tonen dat het controleren van piekholtedruk binnen ±2% kritische dimensies binnen ±0.05mm kan houden op precisieonderdelen.
Hoe werkt een holtedruksensor?
Een holtedruksensor is een transducer ingebed in de matrijs die de smeltdruk realtime omzet in een elektrisch signaal. Twee sensortypen domineren de markt: direct-contact (piëzo-elektrisch) en indirect (rekgebaseerd). Elk heeft afwegingen die van invloed zijn op waar je ze plaatst en hoe lang ze meegaan in productie.
Direct piezo-elektrische sensor3s zitten vlak met de holteoppervlak en meten smeltdruk via een membraan dat direct contact maakt met het plastic. Ze bieden de snelste respons (sub-milliseconde) en de meest accurate meting van de actuele smeltdruk. Het nadeel: ze vereisen een machinale pocket in het vormstaal, ze zijn gevoelig voor mechanische schade tijdens vormhandeling, en ze vereisen charge amplifiers om het piezosignaal om te zetten naar een bruikbare voltage.
Indirect strain-gauge sensoren plaatsen achter een ejectorpen of holteinsert. Ze raken het gesmolten materiaal niet — in plaats daarvan meten ze de elastische vervorming van het vormstaal onder holtedruk. Ze zijn duurzamer, makkelijker te retrofit op bestaande vormen en kosten minder. Maar ze reageren trager, en de drukmeting hangt af van het mechanische transferpad (pendiameter, pasruimte, staalhardheid), wat calibratiecomplexiteit introduceert.
Een derde optie die aan populariteit wint is non-contact ultrasone sensoren die buiten het gietvorm worden geplaatst en druk meten door de stalen wand. Deze elimineren de noodzaak voor sensorholtes volledig, maar de nauwkeurigheid is momenteel beperkt — ze zijn beter voor trendmonitoring dan voor absolute drukmeting.
| Functie | Piëzo-elektrisch (Direct) | Strain-Gauge (Indirect) | Ultrasoon |
|---|---|---|---|
| Responstijd | < 1 ms | 2–5 ms | 5–10 ms |
| Nauwkeurigheid | ±0.5% FS | ±1–2% FS | ±3–5% FS |
| Matrijsmodificatie | Pocket vereist | Achter uitstoterpen | Externe montage |
| Duurzaamheid | Matig | Hoog | Hoog |
| Kosten per kanaal | $1.500–$3.000 | $500–$1.500 | $800–$2,000 |
| Beste gebruiksscenario | Precisie gieten | General production | Retrofit monitoring |
Wat Zijn de Belangrijkste Parameters in Holtedrukkrommen?
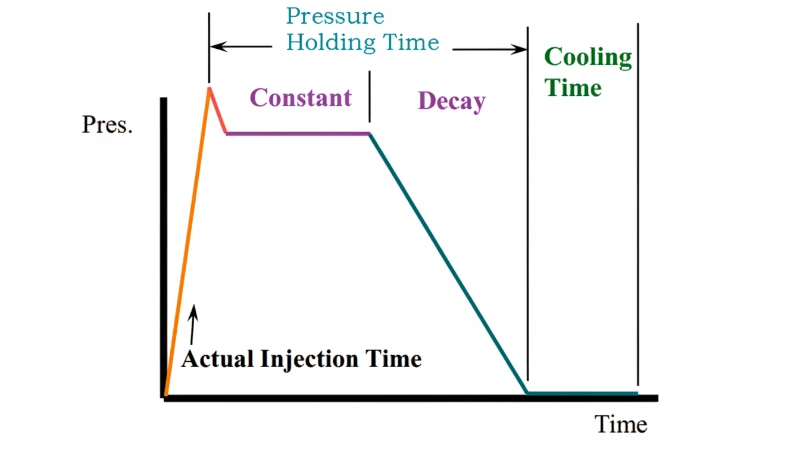
De belangrijkste parameters in een holtedrukcurve zijn vulhelling, overgangspunt, pakplateau, openingstollingsmoment en koelafname. Een typische holtedrukcurve lijkt op een bergketen met duidelijk pieken en dalen. Elk deel van de curve correspondeert met een specifieke fase van de spuitgietcyclus, en ervaren procesingenieurs lezen deze curves als een diagnostische grafiek.
Vulfase (stijging naar piek). De curve stijgt scherp wanneer het smeltmateriaal de holte binnengaat. De helling geeft de vulssnelheid aan. Een steilere helling betekent een snellere injectie. Als de helling halverwege de stijging verandert, zie je veranderingen in stromingsweerstand – mogelijk passeert het smeltmateriaal een dun gedeelte of een scherpe bocht in de holtegeometrie.
Overgangspunt. Dit is waar de machine overgaat van snelheidsgestuurde vulling naar drukgestuurde pakking. Op de curve is het het buigpunt aan de top van de stijging. Een soepele overgang produceert een ronde piek. Een abrupte machineovergang creëert een scherpe piek met een dip — deze overshoot kan flash of gewichtvariatie veroorzaken.
Pakkingsfase (plateau). Na de overgang moet de holtedruk stabiliseren op een plateau — dit is extra materiaal dat in de holte wordt geduwd om volumetrische krimp te compenseren terwijl het deel afkoelt. De hoogte en duur van dit plateau bepalen direct het gewicht, de dimensies en de kans op sinkmarks.
Openingstolling. Op een bepaald moment tijdens de houdfase stolt de opening en blokkeert het stromingspad. Op de drukcurve zie je het plateau eindigen en de druk beginnen te dalen — zelfs terwijl de machine nog druk blijft houden. Dit stollingsmoment van de opening is cruciaal: elke extra houdtijd na het stollen van de opening is verspilde energie. Exact weten wanneer de opening stolt, laat je de houdtijd precies optimaliseren.
Cooling and decay. After gate freeze, pressure decays as the material contracts and cools. The rate of decay depends on part geometry, material shrinkage behavior, and mold temperature. Anomalously fast decay in one region can signal a hot spot in the mold or an insufficient cooling circuit.
““Gate freeze-off time can be identified directly from the cavity pressure curve.””Echt
The pressure curve shows a clear inflection point where cavity pressure starts dropping despite continued machine holding pressure — that is the gate seal point. Beyond this, additional hold time adds no value.
““Higher machine injection pressure always produces higher cavity pressure.””Vals
Cavity pressure depends on flow resistance, gate design, and melt viscosity. A restrictive gate or long runner can absorb most of the machine pressure, leaving cavity pressure unchanged even when you increase injection pressure significantly.
Hoe gebruik je holtedrukdata om het procesvenster te optimaliseren?
Collecting cavity pressure data is one thing. Acting on it is another. The practical workflow looks like this:
Step 1: Establish a golden curve. Run 50–100 cycles at your validated process settings. Record cavity pressure at each sensor location. Average the curves to create a reference — your “golden curve.” This becomes the baseline that every production cycle is compared against.
Step 2: Set tolerance bands. Define acceptable upper and lower limits for key curve parameters: peak pressure, packing plateau level, gate freeze time, pressure at end of hold. These limits should be based on dimensional and visual quality data — not arbitrary percentages.
Step 3: Monitor in real time. Modern monitoring systems (Priamus, Kistler, RJG) compare each cycle’s pressure curve against the golden curve within the tolerance bands. If a cycle falls outside the band, the system flags it — and can optionally divert the part to a quarantine bin automatically.
Step 4: Diagnose root causes from curve deviations. This is where experience matters. A lower-than-normal peak pressure usually means either insufficient fill speed or a viscosity change in the material. A shorter packing plateau suggests the gate froze earlier — possibly because of lower melt temperature. A shifted switchover point indicates machine inconsistency.
Wanneer Moet U Investeren in Holtedrukbewaking?
Cavity pressure monitoring is worth the investment when your part tolerances are under ±0.1mm or when regulatory compliance requires documented process validation. Not every mold needs cavity pressure sensors. If you’re running commodity parts with ±0.5mm tolerances and wide aesthetic specifications, the investment is hard to justify. But for specific situations, the ROI is clear and fast.
Medical and automotive parts. Regulatory requirements (FDA, ISO 13485, IATF 16949) increasingly expect documented process validation. Cavity pressure data provides objective evidence that each cycle met validated conditions — not just that a random sample passed inspection.
High-cavitation molds. When you’re running a 32-cavity mold, cavity pressure monitoring can detect individual cavity blockages or imbalances that would be invisible from machine data alone. One blocked cavity out of 32 means 3% scrap — which adds up fast at 500,000 cycles per year.
Tight-tolerance engineering plastics. Materials like PEEK, LCP, and glass-filled nylons have narrow processing windows. Cavity pressure monitoring catches viscosity shifts from lot-to-lot material variation before they produce out-of-spec parts.
Long production runs. The per-part cost of monitoring drops dramatically as volume increases. A $10,000 monitoring system amortized over 2 million parts adds half a cent per part — trivial compared to the cost of a single rejected shipment.
““Cavity pressure monitoring can detect individual cavity blockages in multi-cavity molds in real time.””Echt
Each sensor monitors its own cavity independently. A sudden pressure drop or complete absence of signal at one sensor location immediately flags a blocked or underfilled cavity, while neighboring cavities continue showing normal curves.
““Cavity pressure monitoring eliminates the need for post-molding quality inspection entirely.””Vals
Cavity pressure catches process-related defects like short shots, sink marks, and dimensional variation. But it cannot detect cosmetic defects like color inconsistency, surface contamination, or assembly errors. Final visual and dimensional inspection remains necessary.
Wat Zijn de Beperkingen van Holtedrukbewaking?
Cavity pressure monitoring is limited by sensor fragility, placement sensitivity, data overload, and inability to detect cosmetic defects. Here’s what the sensor vendors won’t tell you on the first call.
Sensors fail. Piezoelectric sensors in particular are fragile. A careless mold setter can destroy a $2,000 sensor during mold installation. Thermal cycling degrades sensor performance over thousands of cycles. You need a maintenance and recalibration plan — or you’ll be making decisions based on drifting data.
Placement is everything. A sensor in the wrong location gives you misleading data. Too close to the gate and you measure runner pressure, not cavity behavior. Too far from the last-to-fill point and you miss the most critical region. Most engineers place sensors at two locations: near the gate (to monitor injection and packing) and near the end of fill (to confirm complete filling).
Data overload is real. A single sensor generates thousands of data points per cycle. A 4-sensor mold running 24/7 produces terabytes per year. Without proper software to filter, trend, and alert, you end up with a massive database nobody looks at. The monitoring system is only as useful as the analytics behind it.
Cost adds up on multi-cavity molds. If each cavity needs its own sensor, a 16-cavity mold requires 32 sensors (gate + end-of-fill per cavity). At $1,500–$3,000 per channel, that’s $48,000–$96,000 in sensor hardware alone — before the monitoring system, cabling, and installation.
Not all defects are pressure-related. Color streaks, contamination, ejector pin marks, and mold surface defects have nothing to do with cavity pressure. Monitoring pressure won’t prevent these issues. It’s a powerful tool, but it’s one tool — not a complete quality system.
Bottom line: If you’re scrapping more than 2% of parts from process-related defects, cavity pressure monitoring usually pays for itself within 6–12 months. Start with one sensor on your highest-volume, tightest-tolerance mold. Prove the ROI on that tool, then scale.
If you are comparing vendors for a monitored production program, use our injection molding supplier sourcing guide to check process-control maturity, validation records, sensor maintenance discipline, and quality escalation rules before awarding the tool.
Veelgestelde Vragen over Holtedrukbewaking
What is cavity pressure in injection molding?
Cavity pressure is the force per unit area exerted by the molten plastic inside the mold cavity during the injection, packing, and holding phases of the molding cycle. It is typically measured in bar or psi using pressure sensors embedded directly in the mold steel. This measurement reflects the actual conditions the material experiences inside the cavity — unlike machine-side pressure, which only shows what the injection unit is delivering from the nozzle. Cavity pressure directly influences part weight, dimensions, surface quality, and structural integrity of the final molded component.
How many cavity pressure sensors do I need per mold?
De meeste productietoepassingen gebruiken twee sensoren per holte: één geplaatst nabij de poort om het inspuit- en pakgedrag te monitoren, en één nabij het einde van de vulling om een volledige holtevulling te bevestigen. Voor eenvoudige onderdelen met ruime toleranties kan een enkele sensor volstaan. Voor meervoudige holtevormen is een praktische aanpak om representatieve holten te instrumenteren in plaats van elke afzonderlijke, en vervolgens de resultaten te extrapoleren. Het exacte aantal hangt af van de complexiteit van de onderdelveometrie, tolerantie-eisen, uw budget en het niveau van kwaliteitsdocumentatie dat uw klant of regelgevende instantie vereist.
Wat is het verschil tussen holtedruk en nozzledruk?
Snoerdruk wordt gemeten aan de inspuitmond van de machine en weerspiegelt de uitgangskracht van de schroef tijdens het inspuiten. Holtedruk wordt gemeten in de mal en weerspiegelt wat het kunststof daadwerkelijk ervaart tijdens het vullen, pakken en afkoelen in de holte. Het verschil tussen de twee vertegenwoordigt de druk die verloren gaat door de tuit, het lopersysteem en de poort. Dit drukverlies kan aanzienlijk zijn — vaak wordt 30–60% van de snoerdruk verbruikt voordat de smelt zelfs de holte binnenkomt, afhankelijk van de lengte en diameter van de loper en het poortontwerp.
Kan holtedrukbewaking de kwaliteit van laslijnen detecteren?
Ja, holtedrukbewaking geeft direct inzicht in de vorming en sterkte van laslijnen. Wanneer twee stromingsfronten elkaar ontmoeten in de holte, geeft de druk op de laslijnlocatie aan hoe goed de fronten samengesmolten zijn. Hogere holtedruk bij de laslijn betekent betere moleculaire verstrengeling over het grensvlak, wat resulteert in een sterkere laslijn. Dit is vooral waardevol voor structurele onderdelen waar laslijnintegriteit een kritieke prestatieparameter is en falen bij de laslijn de gehele assemblage in gevaar kan brengen.
Wat is wetenschappelijk spuitgieten en hoe verhoudt holtedruk zich daartoe?
Wetenschappelijk spuitgieten is een data-gedreven methodologie die het spuitgietproces ontkoppelt in vier verschillende fasen – vullen, pakken, vasthouden en koelen – en elke fase onafhankelijk bestuurt op basis van meetbare variabelen in plaats van alleen machine-instellingen. Holtedruk is de primaire meetvariabele in wetenschappelijk spuitgieten omdat deze direct weerspiegelt wat het materiaal daadwerkelijk in de matrijs doet. Door de holtedruk op belangrijke locaties te monitoren, kunnen ingenieurs herhaalbare, overdraagbare procesparameters vaststellen die consistente onderdelen produceren, ongeacht welke machine of fabriek de matrijs bedient.
Hoeveel kost het implementeren van holtedrukbewaking?
Een basisbewakingssysteem met twee kanalen — inclusief holtedruksensoren, ladingsversterker of signaalconditioner, data-acquisitiehardware en basisanalysesoftware — kost doorgaans tussen $5.000 en $15.000 voor een toepassing met één holte. Voor volledige productiebewaking op een productiemal met meerdere holten, uitgebreide analysesoftware, geautomatiseerde onderdeelafleidingsmogelijkheden en historische trenddashboards kunnen de kosten variëren van $30.000 tot meer dan $100.000. De totale investering schaalt direct met het aantal sensorkanalen, de verfijning van het analyseplatform en de fabrieksintegratievereisten.
Kan ik holtedruksensoren achteraf inbouwen in een bestaande mal?
Ja, retrofit is gangbaar en praktisch. Rekstrookjesensoren gemonteerd achter bestaande uitwerpstiften zijn de populairste retrofitoptie omdat ze minimale matrijsaanpassing vereisen – meestal alleen het frezen van een zak achter een bestaande stift en het leiden van de kabel door de uitwerpplaat. Directe piëzo-elektrische sensoren zijn ook mogelijk voor retrofits maar vereisen uitgebreidere bewerking van het holtestaal om een inbouwzak voor het sensordiafragma te creëren. De retrofitkosten zijn aanzienlijk lager dan het vanaf nul inbouwen van sensoren in een nieuwe matrijs.
Werkt holtedrukbewaking met alle kunststofmaterialen?
Holtedrukbewaking werkt met alle thermoplastische materialen, van commodityharsen zoals PP en PE tot hoogwaardige technische kunststoffen zoals polycarbonaat, nylon en PEEK. De drukcurvekarakteristieken verschillen echter aanzienlijk tussen materialen. Hoogviskeuze materialen zoals polycarbonaat en PEEK genereren hogere vuldrukken en verschillende curvevormen vergeleken met laagviskeuze materialen zoals polypropyleen. De monitoringdrempels, tolerantiebanden en gouden curveparameters moeten onafhankelijk worden gekalibreerd voor elke specifieke materiaal- en matrijscombinatie om zinvolle procescontrolegegevens tijdens de productie te leveren.
Klaar om holtedrukbewaking te implementeren?
Als u precisieonderdelen produceert met strikte toleranties — vooral in de medische, automotive of elektronica-industrie — is holtedrukbewaking niet langer optioneel. Het is de manier om van 'we denken dat het proces goed is' naar 'we kunnen aantonen dat elke cyclus aan de specificatie voldeed' te gaan.
In onze fabriek gebruiken onze ingenieurs procesbewaking door de hele Shanghai-faciliteit omdat gereguleerde klanten gedocumenteerde, data-onderbouwde procescontrole eisen. Met meer dan 400 gekwalificeerde materialen en een 6-stappen kwaliteitscontroleproces van inkomende inspectie tot uitgaande verificatie, begrijpen we dat consistente kwaliteit begint met begrip van wat er in de matrijs gebeurt.
Wilt u holtedrukbewaking bespreken voor uw volgende gereedschapsproject? Praat met een spuitgietfabrikant — we zullen uw onderdeelgeometrie, toleranties en productievolume beoordelen om het juiste niveau van procesbewaking voor uw toepassing aan te bevelen.
-
zinkmerk: zinkmerk verwijst naar een oppervlakteverzakking op gespoten onderdelen veroorzaakt door onvoldoende pakdruk tijdens de houdfase. ↩
-
injection mold: Spuitgietmatrijs verwijst naar een precisiegereedschap dat wordt gebruikt bij spuitgieten en één of meer holtes bevat die gevormd zijn om kunststofonderdelen te vormen. ↩
-
piëzo-elektrische sensor: piëzo-elektrische sensor verwijst naar een direct-contact drukomzetter die elektrische lading genereert die evenredig is met de uitgeoefende smeltdruk. ↩