Zum Inhalt springen

„Die empirische V/Q-Formel berücksichtigt den Druckverlust im Verteilerkanalsystem.“ Spritzgießen. Macht man es richtig, erhält man maßhaltige Teile mit glatten Oberflächen; macht man es falsch, hat man mit Kurzläufern, Einfallstellen, Grat oder verbranntem Material zu rechnen. In einer Werkhalle mit 47 Maschinen und Pressen von 90 bis 1850 Tonnen summiert sich selbst eine 0,3-Sekunden-Überschreitung der Füllzeit auf Tausende fehlerhafter Teile pro Schicht.
Dieser Leitfaden führt durch jede praktische Methode, die Ingenieure zur Berechnung der Füllzeit verwenden – von der einfachen V/Q-Formel, die man auf einem Taschenrechner ausführen kann, bis zur Moldflow-Simulation, die nicht-newtonsches Fließverhalten berücksichtigt. Unterwegs zeige ich die Fallstricke auf, in die viele tappen, und teile Erkenntnisse aus zwei Jahrzehnten Produktionslauf bei ZetarMolds Standort in Shanghai.
- Filling time = cavity volume divided by volumetric flow rate (tf = V/Q).
- Material viscosity, mold geometry, and machine settings all influence fill time.
- Simulation tools (Moldflow, Moldex3D) give plus or minus 5% accuracy for complex molds.
- Optimizing fill time reduces cycle time, cuts scrap, and improves part quality.
- Real-world validation is always the final step — no formula replaces a trial shot.
What Is Injection Molding Machine Filling Time?
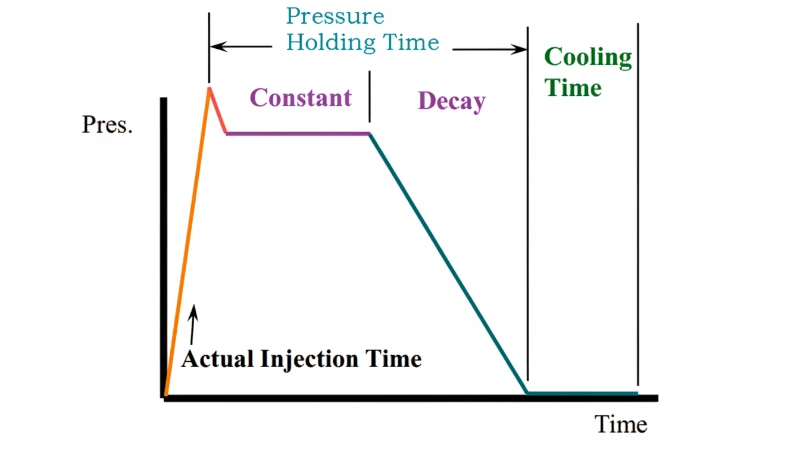
Die Füllzeit einer Spritzgießmaschine ist die Dauer der Füllphase von der Schneckenbewegung bis zur vollständigen Kavitätenfüllung. Sie schließt Nachdruck- und Haltezeit aus, daher nutzen Ingenieure sie, um das erste Geschwindigkeitsprofil festzulegen, die Scherwärme abzuschätzen und die Maschinenkapazität mit dem Werkzeugvolumen zu vergleichen.
Im Produktionsumfeld wird der Begriff „Füllzeit“ manchmal mit der gesamten Einspritzzeit verwechselt. Sie sind nicht dasselbe. Die gesamte Einspritzzeit auf dem Maschinentimer umfasst Füllung plus Nachdruck; die V/Q-Formel gilt nur für die Füllphase. Beides zu vermischen ist einer der häufigsten Fehler, den ich bei Ingenieuren sehe, wenn sie ein neues Werkzeug einrichten.
Die Spritzgussform geometry — runner layout, gate type, wall thickness distribution — dictates how the melt front advances. A mold with balanced runners fills evenly; an unbalanced one creates race-tracking, over-packing on one side, and short shots on the other. That is why mold design and fill-time calculation are inseparable.
Why Does Filling Time Matter for Product Quality?
Die Füllzeit ist wichtig, weil sie die Schmelztemperatur, den Druckübertrag, Schweißlinien, Kurzläufer, Grat und die Zykluszeit steuert. Eine zu langsame Füllung friert die Fließfront ein, bevor der Hohlraum voll ist, während eine zu schnelle Füllung das Material überscherren oder Grat an der Trennlinie erzwingen kann.
Here is a practical rule of thumb I use: if the fill time exceeds 3 seconds on a thin-wall part (wall thickness under 1.5 mm), the probability of a short shot rises above 15 percent. If the fill time is under 0.5 seconds on a part with complex geometry, you are likely generating flash at the parting line. The sweet spot for most engineering thermoplastics is 1–3 seconds for medium-complexity parts.
Neben der Teilequalität beeinflusst die Füllzeit direkt die Zykluszeit und den Durchsatz. Eine Reduzierung um 0,5 Sekunden bei einem 12-Sekunden-Zyklus in einem 16-fach-Werkzeug im Dauerbetrieb bedeutet etwa 250.000 zusätzliche Teile pro Jahr und Maschine. Bei 47 Pressen in einer Fabrik sind das über 11 Millionen zusätzliche Teile jährlich – ein erheblicher Umsatz- und Kostenbonus.
„Füllzeit und Nachdruckzeit sind separate Phasen im Spritzzyklus.“Wahr
Correct. Filling time covers only the phase when the cavity goes from empty to volumetrically full. Packing time is the subsequent phase where additional material is pushed in to compensate for shrinkage. Most machine timers show injection time as the sum of both.
„Eine längere Füllzeit erzeugt immer eine bessere Oberflächengüte.“Falsch
Excessively long fill time allows the melt to cool and increase in viscosity, which can cause flow marks, weld lines, and short shots. Optimal surface finish comes from the right fill speed — not the slowest one.
What Factors Affect Filling Time?
Die Hauptfaktoren, die die Füllzeit beeinflussen, sind Materialviskosität, Werkzeuggeometrie, Einspritzgeschwindigkeit, Druckgrenze sowie Schmelz- und Werkzeugtemperatur. Das Fließverhalten des Materials setzt die Basis, während Angusslänge, Gate-Größe, Wandstärke und die Durchflusskapazität der Maschine bestimmen, ob der Hohlraum gefüllt wird, bevor die Fließfront erstarrt.
Material Viscosity
Viscosity is the single biggest material factor. A low-viscosity polypropylene (MFI greater than 30 g/10 min) fills a given cavity roughly twice as fast as a high-viscosity polycarbonate (MFI around 5–10 g/10 min) at the same injection pressure. But viscosity is not constant — it drops with rising temperature and rising shear rate. This shear-thinning1 Verhalten macht die nicht-Newtonsche Modellierung für genaue Vorhersagen unerlässlich.
Geometrie der Form
Runner length and diameter, gate size, number of cavities, and wall-thickness distribution all create flow resistance. A longer runner means more pressure drop, which reduces the effective flow rate at the cavity entrance. Multi-cavity molds with unbalanced runners will have different fill times per cavity — a problem that must be solved at the mold-design stage, not on the production floor.
Machine Parameters
Einspritzgeschwindigkeit, Einspritzdruckgrenze, Schneckendurchmesser und Düsenspitzengeometrie bestimmen die maximale volumetrische Durchflussrate Q, die die Maschine liefern kann. Bei einer 200-Tonnen-Presse mit 40-mm-Schnecke bei 150 mm/s beträgt Q etwa Pi mal 20² mal 150, also rund 188,5 cm/s. Tauscht man diese Schnecke gegen eine 30-mm-Version, sinkt Q auf etwa 106 cm/s – die Füllzeit steigt für denselben Hohlraum sofort um rund 78 Prozent.
Melt and Mold Temperature
Higher melt temperature reduces viscosity, speeding up the fill. Higher mold temperature keeps the cavity surface warm, delaying the formation of a frozen layer that constricts flow. Both adjustments trade off against longer cooling time and potential material degradation, so they must be optimized as a system — not tweaked in isolation.
How Do You Calculate Filling Time?
There are four main methods, each trading simplicity for accuracy. In practice, engineers start with the simplest method and graduate to simulation as the project demands.
Method 1 — Empirical Formula (tf = V / Q)
Die am weitesten verbreitete schnelle Schätzung ist das Volumenverhältnis. Kavitätenvolumen V (in cm³) geteilt durch den volumetrischen Durchfluss Q (in cm³/s) der Maschine ergibt die Füllzeit in Sekunden. Der Durchfluss wird aus der Querschnittsfläche A der Schnecke und der Einspritzgeschwindigkeit v der Schnecke berechnet. In Formelform: Q gleich A mal v, was gleich pi mal (D geteilt durch 2) zum Quadrat mal v ist. Dann ist tf gleich V geteilt durch Q.
Praktisches Beispiel – PP-Gehäuse mit einer 30-mm-Schnecke bei 100 mm/s, Kavitätenvolumen 200 cm³. Die Schneckenfläche A ist gleich pi mal 15², was 706,86 mm² ergibt. Der Durchfluss Q ist gleich 706,86 mm² mal 100 mm/s, was 70.686 mm³/s oder etwa 70,69 cm³/s entspricht. Teilen des Kavitätenvolumens 200 cm³ durch 70,69 cm³/s ergibt eine Füllzeit von etwa 2,83 Sekunden.
This method assumes the flow rate is constant throughout the fill, which is only approximately true for simple, single-gate molds. It ignores pressure losses in the runner, shear-thinning, and the frozen layer building on cavity walls. Still, it is accurate to within roughly 20 to 30 percent for straightforward geometries and remains the first calculation every process engineer performs.
Method 2 — Newtonian Fluid Model
For Newtonian fluids, viscosity is constant regardless of shear rate. Under this assumption, you can use the Hagen-Poiseuille equation2 für die Strömung durch Kanäle bekannter Abmessungen und berechnet den Druckabfall in jedem Angusssegment, um dann Q aus dem verfügbaren Einspritzdruck abzuleiten. In der Praxis verhalten sich nur sehr wenige Thermoplaste während des Formfüllens als echte Newtonsche Fluide – die meisten sind scherverdünnende pseudoplastische Materialien. Das Newtonsche Modell ist hauptsächlich als Lehrmittel und zur Plausibilitätsprüfung von Simulationsergebnissen nützlich.
Method 3 — Non-Newtonian (Power-Law) Model
Die power-law model3 beschreibt die Beziehung zwischen Scherspannung und Schergeschwindigkeit mit zwei Parametern – dem Konsistenzindex k und dem Fließverhaltensindex n. Für die meisten Thermoplaste ist n kleiner als 1, was ein scherverdünnendes Verhalten bedeutet. Ein typisches PP könnte bei Verarbeitungstemperaturen einen n-Wert von etwa 0,3 bis 0,4 aufweisen. Das Potenzgesetzmodell liefert eine bessere Schätzung von Q unter tatsächlichen Spritzgießbedingungen, da es die Viskositätsreduktion bei hohen Schergeschwindigkeiten in der Nähe des Angusses berücksichtigt.
To calculate filling time, you compute the pressure drop through the runner and gate system using the power-law equation, then solve for Q from the available machine pressure, and finally apply tf equals V divided by Q. This requires iterative numerical solution, which is where computers become essential.
„Die meisten Thermoplaste sind scherverdünnend, das heißt, die Viskosität sinkt mit steigender Scherrate.“Wahr
Correct. Under the power-law model, most thermoplastics have a flow behavior index n less than 1, so effective viscosity drops at higher shear rates. This is why injection speed has a non-linear effect on fill time and why faster injection can fill cavities more efficiently than a simple linear model would predict.
„Die empirische V/Q-Formel berücksichtigt den Druckverlust im Angusssystem.“Falsch
Häufig gestellte Fragen zum Ausfüllen von Zeitangaben
Method 4 — Numerical Simulation (Moldflow or Moldex3D)
Moderne CAE-Tools lösen die vollständigen Impuls-, Energie- und Kontinuitätsgleichungen auf einem 3D-Netz der Werkzeuggeometrie unter Verwendung der tatsächlichen rheologischen Daten des Materials (oft vom Harzhersteller bereitgestellt). Der Arbeitsablauf ist: CAD importieren, Modell vernetzen, Materialdaten zuweisen, Prozessbedingungen festlegen, Solver ausführen, dann Ergebnisse analysieren.
Simulation accuracy for filling time is typically within 3 to 8 percent compared to measured values — a dramatic improvement over the 20 to 30 percent margin of the empirical formula. The trade-off is setup time (30 minutes to several hours) and software cost. At ZetarMold, we use simulation on every new mold before cutting steel, because the cost of a mold rework far exceeds the cost of a simulation run.
For the PP housing example above, Moldflow predicted a fill time of 2.85 seconds — within 0.7 percent of the measured 2.83 seconds. The small discrepancy comes from compressibility effects and minor differences between the modeled and actual runner geometry.
„Profiliierte Einspritzgeschwindigkeit kann die Füllzeit reduzieren und gleichzeitig die Fehlerrate senken.“Wahr
By starting slow through the gate (preventing jetting), speeding up in the cavity, and decelerating near end-of-fill (allowing air evacuation), profiled injection achieves the best of both worlds — shorter fill and fewer defects. Most modern machines support 5 to 10 velocity stages.
„Das Hinzufügen eines zweiten Angusses verbessert immer die Bauteilqualität.“Falsch
A second gate reduces fill time but introduces a weld line where the two melt fronts meet. If the weld line falls on a structural or cosmetic surface, the part may be weaker or visually defective. Gate placement must be optimized holistically using simulation to predict weld-line location.
How Do All Calculation Methods Compare?
Die Berechnungsmethoden sind empirisch V/Q, Newtonsches Fließen, Potenzgesetz-Fließen und numerische Simulation. Die einfache V/Q-Methode ist schnell genug für erste Schätzungen, während Moldflow oder Moldex3D die beste Vorhersage für dünnwandige, mehrfach beaufschlagte oder Hochrisiko-Produktionswerkzeuge liefert.
| Method | Calculated Fill Time | Accuracy vs. Measured | Setup Effort |
|---|---|---|---|
| Empirical (V/Q) | 2.83 s | baseline | 1 minute |
| Newtonian model | 2.83 s | same assumptions | 10 minutes |
| Power-law model | 2.78 s | approximately minus 1.8% | 30 minutes |
| Moldflow simulation | 2.85 s | plus 0.7% | 1 to 2 hours |
| Measured (trial shot) | 2.80 s | actual | 2 to 4 hours |
Für dieses relativ einfache, einstufig beaufschlagte Bauteil stimmen alle Methoden innerhalb von 2 Prozent überein. Die Unterschiede werden bei mehrfach beaufschlagten, dünnwandigen oder umspritzten Bauteilen viel größer – genau die Situationen, in denen sich Simulation auszahlt. Bei Bauteilen mit engen Toleranzen (CNC-gefertigte Werkzeuge mit ±0,05 mm) kann selbst ein Füllzeitfehler von 0,2 Sekunden die Maße außerhalb der Spezifikation bringen, weshalb die meisten Hochpräzisions-Spritzgießer die Berechnung vor der Serienproduktion anhand einer Kurzschussstudie validieren.
How Can You Optimize Filling Time?
Calculating fill time is only the beginning. Optimizing it — reducing cycle time while maintaining or improving part quality — is where the real engineering value lies. Here are the levers we pull most often on the production floor.
Increase Injection Speed
Raising the screw velocity from 100 mm/s to 150 mm/s in our example drops fill time from 2.83 s to about 1.89 s. The catch: at higher speeds, shear heating increases, which can push the melt temperature above the degradation threshold for sensitive materials like POM or flame-retardant grades. Always monitor melt temperature with a pyrometer after speed changes.
Optimize Runner and Gate Design
Adding a second gate to our example mold reduced simulated fill time from 2.85 s to 1.75 s — a 39 percent improvement. Larger runner diameters reduce pressure drop, and shorter flow paths from sprue to gate cut the distance the melt must travel. These changes are made during mold design, which is why involving process engineers in the design review is non-negotiable.
Raise Melt Temperature Within Limits
Increasing melt temperature from 220 degrees C to 240 degrees C for PP can reduce viscosity by 20 to 30 percent, shortening fill time proportionally. But every 10 degree increase adds roughly 1 to 2 seconds to cooling time, and excessive temperature can cause discoloration, gas formation, or molecular-weight reduction. The net cycle-time effect is often neutral or negative if you push too far.
Use Profiled Injection Speed
Rather than running at a single speed, modern machines allow multi-stage velocity profiles — slow through the gate to prevent jetting, then fast through the cavity, then slow again near the end of fill to prevent flash and allow air to escape. Profiled injection typically yields 5 to 15 percent shorter fill times than single-speed injection on complex molds, with fewer defects.
What Does Real-World Production Teach Us About Filling Time?
Die Praxis zeigt, dass die Füllzeit eine Schätzung ist, die mit Kurzläuferstudien, Kavitätenbalanceprüfungen und Teileinspektion validiert werden muss. In unserer Shanghai-Einrichtung beginnen wir mit der V/Q-Schätzung, bestätigen das Füllmuster und optimieren dann die Geschwindigkeitsprofile anhand von Fehlern, Zykluszeit und Maßhaltigkeit.
Die reale Produktion lehrt, dass die Füllzeit eine Schätzung ist, die durch Kurzschussstudien, Kavitätenausgleichsprüfungen und Bauteilinspektionen validiert wird. In unserer Einrichtung in Shanghai beginnen wir mit der V/Q-Schätzung, um die anfängliche Einspritzgeschwindigkeit festzulegen, führen dann Kurzschussstudien durch, bevor wir die Geschwindigkeitsprofile anhand von Fehlern, Zykluszeit und Maßhaltigkeit optimieren.
One lesson that took years to internalize: the fastest fill time is rarely the best fill time. On a multi-cavity mold for automotive connectors, we found that running at 85 percent of maximum injection speed actually yielded lower scrap than running flat-out, because the slightly slower fill gave the vents enough time to evacuate air. The 0.3 seconds we added to fill time saved 12 percent in scrap — a far larger cost saving than the tiny throughput reduction.
Wenn Sie spritzgegossene Teile beschaffen und einen Lieferanten suchen, der die Füllzeit wissenschaftlich optimiert, anstatt nur die Maschinengeschwindigkeit hochzudrehen, werfen Sie einen Blick in unseren Leitfaden zur Beschaffung von Spritzgießlieferanten, um einen Rahmen für die Bewertung von Fertigungspartnern zu erhalten.

Frequently Asked Questions About Filling Time
Das Potenzgesetz-Fluidmodell, auch als Potenzgesetz- oder Ostwald-de-Waele-Modell bekannt, setzt die Scherspannung mit der Scherrate über die Gleichung τ = k × γ̇ⁿ in Beziehung, wobei k der Konsistenzindex und n der Fließverhaltensindex ist.
Most medium-complexity thermoplastic parts fill in 1 to 3 seconds under standard processing conditions on typical production equipment. Thin-wall packaging molds may fill in under 0.5 seconds, while large structural parts with thick walls can take 5 to 10 seconds to fill completely. The exact range depends on cavity volume, material viscosity, wall thickness, and the injection molding machine maximum flow rate capability. Always benchmark against similar molds in your own production history to establish a realistic baseline before fine-tuning process parameters for a new mold project.
How do you measure actual filling time on a machine?
Most modern injection molding machines display fill time directly on the controller screen, making it easy to read during initial setup and subsequent process optimization runs. You can also observe the transition from injection pressure to holding pressure on the pressure-versus-time graph, where the inflection point clearly marks the end of the fill phase. For older machines without digital readouts, a stopwatch from screw start to the pressure switchover click gives a reasonable approximation of the actual fill duration in seconds.
Does filling time change with different plastics?
Yes, filling time changes significantly with different plastics due to their varying melt viscosities and thermal properties during the molding process. Low-viscosity materials like polypropylene with an MFI above 20 fill faster than high-viscosity materials like polycarbonate or PEEK, even at the same injection pressure setting on the machine. The material shear-thinning behavior also plays an important role in practice — some polymers thin dramatically under high shear rates, which effectively speeds up cavity filling compared to what a constant-viscosity calculation would predict.
Can filling time be too short?
Absolutely, filling time can definitely be too short for the specific part and mold design at hand. Extremely fast fills cause excessive shear heating, air traps, jetting through the gate, and flash at the parting line of the mold. On transparent parts, jetting creates visible worm-like cosmetic defects on the surface; on structural parts, trapped air causes internal burns and mechanically weak spots. The optimal fill time balances speed with part quality and dimensional consistency — it is not always the minimum possible time your machine can achieve.
What happens if filling time is too long?
When filling time is too long, the melt cools progressively and thickens as it flows through the cavity, increasing the risk of short shots, surface flow marks, and high residual stress in the finished part. Thin-wall parts are especially sensitive to this particular problem — if the frozen layer closes off the flow channel before the cavity is completely full, you get an incomplete part. Long fill times also reduce overall production throughput by extending the injection phase of the molding cycle unnecessarily.
Is Moldflow simulation worth the cost for small molds?
For simple single-cavity molds with straightforward geometry, the basic V/Q formula is usually sufficient for initial setup and saves the simulation fee entirely. For multi-cavity, thin-wall, or high-precision molds, simulation pays for itself by preventing even a single mold revision, which typically costs 10 to 50 times the combined simulation software and engineering time fee. As a practical guideline, any mold with more than two cavities or a flow-length-to-thickness ratio above 100 should definitely be simulated before the mold tool is cut.
How does wall thickness affect filling time?
Thinner walls restrict polymer flow and increase viscous resistance in the mold cavity, requiring higher injection pressure and often resulting in longer overall fill times for the part. The flow length-to-thickness ratio is a key metric for judging fillability of a design — ratios above 150 typically require very high injection speeds to fill completely without short shots. Product designers should aim for uniform wall thickness throughout the part geometry to avoid flow hesitations that cause air traps, weld-line visibility issues, and uneven fill patterns.
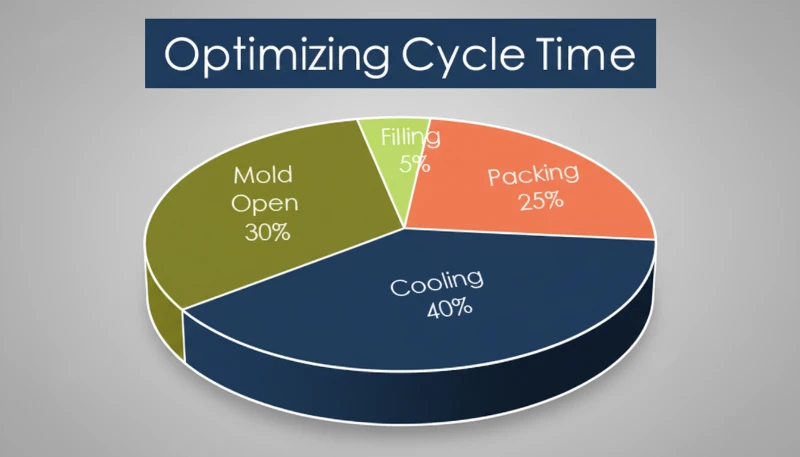
What is the difference between fill time and cycle time?
Fill time is just the cavity-filling phase, typically lasting 1 to 3 seconds depending on part size, material choice, and mold complexity. Cycle time includes the complete sequence of filling, packing, cooling, mold opening, ejection, and mold closing — usually 10 to 60 seconds total for a complete production molding cycle. Fill time is typically only 5 to 15 percent of the total cycle. Reducing fill time alone may not significantly reduce overall cycle time if cooling is the dominant bottleneck in the process.
Schlussfolgerung
Filling time sits at the intersection of material science, mold engineering, and machine capability. The simplest calculation — tf equals V divided by Q — gives you a useful starting point. Adding rheological modeling or full simulation progressively improves accuracy. And real-world trial shots remain the ultimate validation.
Optimizing fill time is not about chasing the fastest possible number. It is about finding the speed that delivers dimensionally stable, cosmetically clean parts at the lowest total cost — accounting for cycle time, scrap rate, and tooling longevity. That balance is exactly what our engineering team at ZetarMold works toward on every project.
Need help optimizing your injection molding process? Das Ingenieurteam von ZetarMold bietet DFM-Feedback, Werkzeugfluss-Simulation und Produktionsprozessoptimierung. Mit 20+ Jahren Erfahrung über 400+ Materialien und 47 Maschinen (90–1850 Tonnen) helfen wir Ihnen, die Füllzeit – und jeden anderen Parameter – korrekt einzustellen. Fordern Sie noch heute ein kostenloses Angebot an.
-
shear-thinning: Scherverdünnung bezieht sich auf das Phänomen, bei dem die Viskosität eines Fluids mit zunehmender Scherrate abnimmt. Die meisten thermoplastischen Schmelzen zeigen dieses Verhalten beim Spritzgießen. ↩
-
Hagen-Poiseuille equation: The Hagen-Poiseuille equation describes laminar flow of a Newtonian fluid through a long cylindrical pipe, relating flow rate to pressure drop, pipe radius, and fluid viscosity. ↩
-
power-law model: power-law fluid model refers to the power-law or Ostwald-de Waele model relates shear stress to shear rate with the equation τ = k × γ̇ⁿ, where k is the consistency index and n is the flow behavior index. ↩