
Вы только что забраковали 3000 деталей из-за утяжина1инспектор обнаруживает слишком поздно. Реальная проблема? Никто не наблюдал за тем, что происходило внутри полости формы во время впрыска. Мониторинг давления в полости даёт вам окно в реальном времени на фазы заполнения, уплотнения и выдержки — так вы выявляете дефекты на машине, а не на погрузочной площадке. В этой статье объясняется, как работают датчики давления в полости, что говорят кривые давления и когда инвестиции действительно окупаются.
- Датчики давления в полости формы измеряют в реальном времени то, что происходит внутри формы
- Кривые давления раскрывают поведение при заполнении, уплотнении и охлаждении, невидимое снаружи
- Научное литье использует данные из полости для создания повторяемых, развязанных процессов
- Наибольшая окупаемость инвестиций достигается для деталей с жесткими допусками, крупносерийного производства или медицинского назначения
- Выбор и размещение датчика так же критичны, как и сама система мониторинга
Что такое мониторинг давления в полости формы при инжекционном формовании?
Мониторинг давления в полости формы — это использование встроенных датчиков внутри полости формы для измерения давления расплава в реальном времени в каждом цикле впрыска. Это даёт вам прямой взгляд на то, что испытывает пластик во время заполнения, уплотнения и выдержки — то, что давление со стороны машины вам сказать не может.
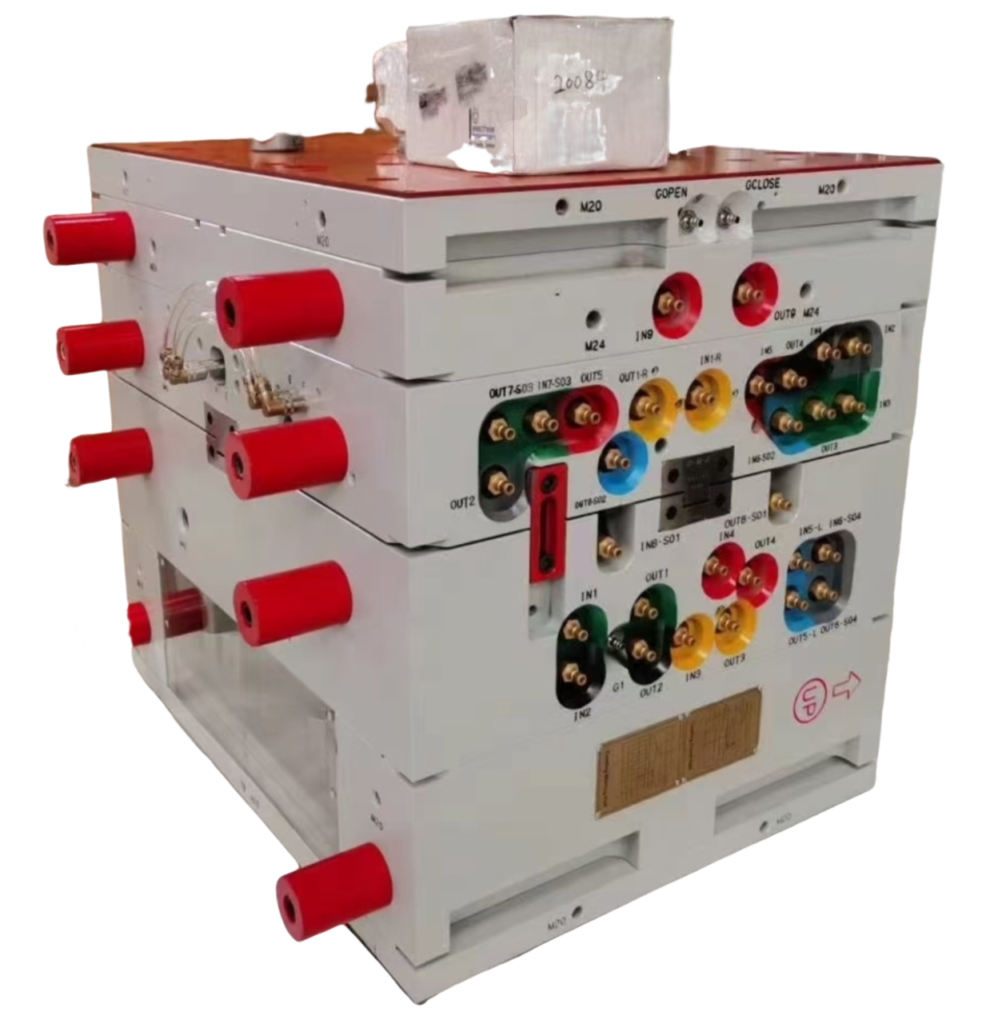
Практика включает в себя установку датчиков давления внутри литьевая форма2 для измерения давления расплава в конкретных местах в каждом цикле. В отличие от датчиков давления на стороне машины, которые показывают только то, что делает шнек, датчики в полости показывают, что пластик фактически испытывает внутри полости. Это различие важно. Очень важно.
В традиционной настройке технолог-процессовик регулирует скорость впрыска, давление подпрессовки и время выдержки на основе внешних наблюдений — недоливов, облоя, утяжин, отчетов по размерам. К моменту обнаружения дефекта цикл уже завершен. Мониторинг давления в полости формы смещает петлю обратной связи от посмертный контроль к обнаружение в процессе.
Концепция возникла из методики научного формования, где цель — разделить четыре фазы литьё под давлением — заполнение, подпрессовка, выдержка и охлаждение — и управлять каждым из них независимо на основе данных, а не интуиции. Давление в полости формы является наиболее информативной переменной в этой методологии.
| Параметр | Давление машины | Давление в полости формы |
|---|---|---|
| Место измерения | Шнек / сопло | Внутри полости |
| Что это показывает | Усилие машины | Поведение материала |
| Обнаруживает недоливы? | Косвенно | Прямо, в реальном времени |
| Обнаруживает утяжины? | Нет | Да — дефицит подпрессовки виден |
| Зависит от конструкции формы? | Нет | Да — геометрия литника имеет значение |
| Стоимость датчика на одну форму | $0 (встроенный) | $500–$3,000 за датчик |
Почему давление в полости формы важно для качества детали?
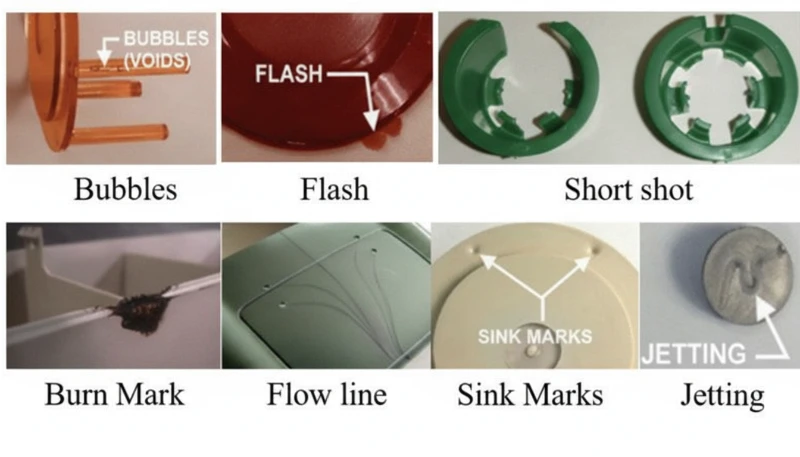
Давление в полости формы — единственная переменная внутри формы, которая непосредственно контролирует вес детали, размеры и образование дефектов во время цикла формования. Большинство дефектов литья под давлением возникают во время фаз заполнения и уплотнения — и давление в полости является единственным параметром, который непосредственно измеряет обе. Когда вы видите усадку, изменение размеров или проблему с линией спая на готовой детали, первопричина была в событии, связанном с давлением, которое произошло на секунды раньше внутри полости.
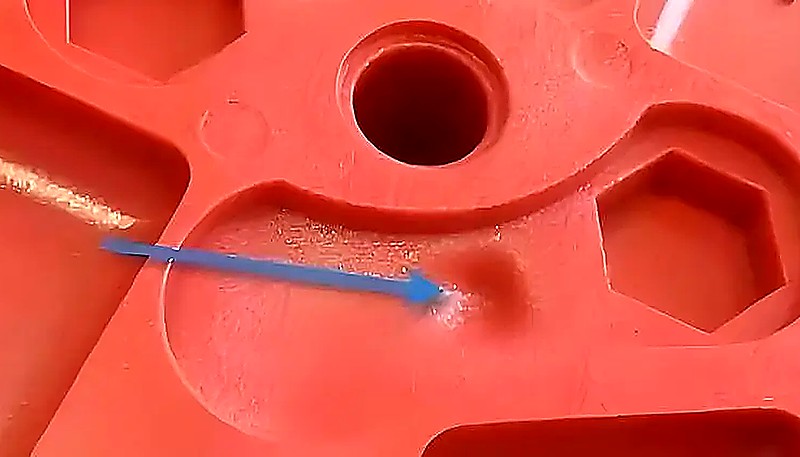
Вот практический пример. Предположим, вы формоваете корпус из поликарбоната с номинальной стенкой толщиной 3 мм и выступающим элементом, создающим участок толщиной 5 мм. Если давление в полости формы в месте расположения выступа слишком быстро падает на этапе подпрессовки, толстый участок не получает достаточной подпрессовки. Результат: утяжина, которая не пройдет визуальный контроль. Без данных о давлении в полости ваш инженер процесса гадает о давлении и времени подпрессовки. С этими данными он видит точно, когда давление падает, и корректирует профиль выдержки для компенсации.
Четыре категории дефектов, которые мониторинг давления в полости формы решает наиболее эффективно:
1. Недоформовка и неполное заполнение. If the pressure curve never reaches the expected peak at the end-of-fill sensor location, the cavity didn’t fill completely. You catch it cycle one — not after a production run of 500 parts.
2. Sink marks and voids. These correlate directly with packing pressure decay. The pressure curve shows whether the cavity received enough material during the hold phase to compensate for volumetric shrinkage.
3. Flash. Excessive cavity pressure — especially when it spikes above the machine’s clamp force threshold — is the precursor to flash. The pressure curve warns you before flash appears on the part.
4. Dimensional variation. Cavity pressure during the packing phase directly determines part weight and dimensions. Studies show that controlling peak cavity pressure within ±2% can hold critical dimensions within ±0.05mm on tight-tolerance parts.
Как работает датчик давления в полости формы?
A cavity pressure sensor is a transducer embedded in the mold that converts melt pressure into an electrical signal in real time. Two sensor types dominate the market: direct-contact (piezoelectric) and indirect (strain-based). Each has trade-offs that affect where you place them and how long they survive in production.
Direct piezoelectric sensor3s sit flush with the cavity surface and measure melt pressure through a diaphragm that contacts the plastic directly. They offer the fastest response time (sub-millisecond) and the most accurate reading of actual melt pressure. The downside: they require a machined pocket in the mold steel, they’re sensitive to mechanical damage during mold handling, and they need charge amplifiers to convert the piezo signal into a usable voltage.
Indirect strain-gauge sensors mount behind an ejector pin or cavity insert. They don’t touch the melt — instead, they measure the elastic deformation of the mold steel under cavity pressure. They’re more durable, easier to retrofit on existing molds, and cheaper. But they respond more slowly, and the pressure reading depends on the mechanical transfer path (pin diameter, fit clearance, steel hardness), which introduces calibration complexity.
A third option gaining traction is non-contact ultrasonic sensors that mount outside the mold and measure pressure through the steel wall. These eliminate the need for sensor pockets entirely, but accuracy is currently limited — they’re better for trend monitoring than absolute pressure measurement.
| Характеристика | Piezoelectric (Direct) | Strain-Gauge (Indirect) | Ultrasonic |
|---|---|---|---|
| Response time | < 1 ms | 2–5 ms | 5–10 ms |
| Точность | ±0.5% FS | ±1–2% FS | ±3–5% FS |
| Mold modification | Pocket required | Behind ejector pin | External mount |
| Долговечность | Умеренный | Высокий | Высокий |
| Cost per channel | $1,500–$3,000 | $500–$1,500 | $800–$2,000 |
| Best use case | Precision molding | General production | Retrofit monitoring |
Какие ключевые параметры в кривых давления в полости?
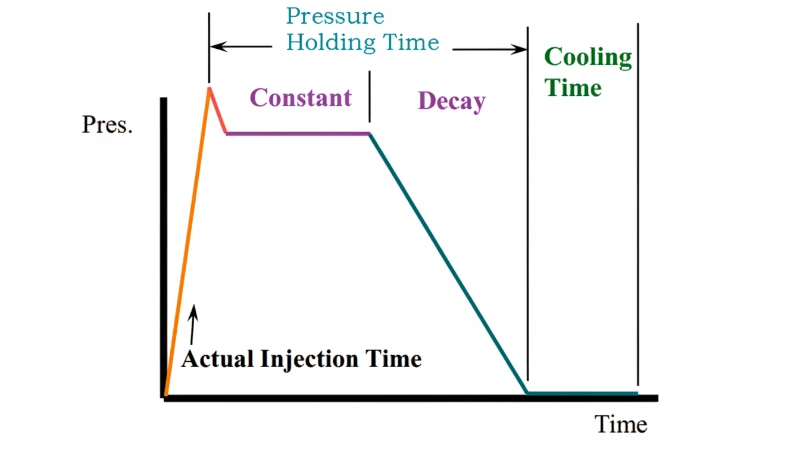
The key parameters in a cavity pressure curve are fill slope, switchover point, packing plateau, gate freeze-off time, and cooling decay rate. A typical cavity pressure curve looks like a mountain range with distinct peaks and valleys. Each region of the curve corresponds to a specific phase of the injection molding cycle, and experienced process engineers read these curves like a diagnostic chart.
Fill phase (rise to peak). The curve rises sharply as melt enters the cavity. The slope tells you the fill speed. A steeper slope means faster injection. If the slope changes mid-rise, you’re seeing flow resistance changes — perhaps the melt is negotiating a thin section or a sharp turn in the cavity geometry.
Switchover point. This is where the machine transitions from velocity-controlled filling to pressure-controlled packing. On the curve, it’s the inflection point at the top of the rise. A smooth switchover produces a rounded peak. An abrupt machine transition creates a sharp spike followed by a dip — this overshoot can cause flash or part weight variation.
Packing phase (plateau). After switchover, cavity pressure should stabilize at a plateau — this is additional material being pushed into the cavity to compensate for volumetric shrinkage as the part cools. The height and duration of this plateau directly determine part weight, dimensions, and the likelihood of sink marks.
Gate freeze-off. At some point during the hold phase, the gate solidifies and cuts off the flow path. On the pressure curve, you see the plateau end and pressure begins to drop — even though the machine is still applying holding pressure. This gate freeze point is critical: any additional holding time beyond gate freeze is wasted energy. Knowing exactly when the gate freezes lets you optimize hold time precisely.
Cooling and decay. After gate freeze, pressure decays as the material contracts and cools. The rate of decay depends on part geometry, material shrinkage behavior, and mold temperature. Anomalously fast decay in one region can signal a hot spot in the mold or an insufficient cooling circuit.
““Gate freeze-off time can be identified directly from the cavity pressure curve.””Правда
The pressure curve shows a clear inflection point where cavity pressure starts dropping despite continued machine holding pressure — that is the gate seal point. Beyond this, additional hold time adds no value.
““Higher machine injection pressure always produces higher cavity pressure.””Ложь
Cavity pressure depends on flow resistance, gate design, and melt viscosity. A restrictive gate or long runner can absorb most of the machine pressure, leaving cavity pressure unchanged even when you increase injection pressure significantly.
Как использовать данные давления в полости для оптимизации технологического окна?
Collecting cavity pressure data is one thing. Acting on it is another. The practical workflow looks like this:
Step 1: Establish a golden curve. Run 50–100 cycles at your validated process settings. Record cavity pressure at each sensor location. Average the curves to create a reference — your “golden curve.” This becomes the baseline that every production cycle is compared against.
Step 2: Set tolerance bands. Define acceptable upper and lower limits for key curve parameters: peak pressure, packing plateau level, gate freeze time, pressure at end of hold. These limits should be based on dimensional and visual quality data — not arbitrary percentages.
Step 3: Monitor in real time. Modern monitoring systems (Priamus, Kistler, RJG) compare each cycle’s pressure curve against the golden curve within the tolerance bands. If a cycle falls outside the band, the system flags it — and can optionally divert the part to a quarantine bin automatically.
Step 4: Diagnose root causes from curve deviations. This is where experience matters. A lower-than-normal peak pressure usually means either insufficient fill speed or a viscosity change in the material. A shorter packing plateau suggests the gate froze earlier — possibly because of lower melt temperature. A shifted switchover point indicates machine inconsistency.
Когда стоит инвестировать в мониторинг давления в полости формы?
Cavity pressure monitoring is worth the investment when your part tolerances are under ±0.1mm or when regulatory compliance requires documented process validation. Not every mold needs cavity pressure sensors. If you’re running commodity parts with ±0.5mm tolerances and wide aesthetic specifications, the investment is hard to justify. But for specific situations, the ROI is clear and fast.
Medical and automotive parts. Regulatory requirements (FDA, ISO 13485, IATF 16949) increasingly expect documented process validation. Cavity pressure data provides objective evidence that each cycle met validated conditions — not just that a random sample passed inspection.
High-cavitation molds. When you’re running a 32-cavity mold, cavity pressure monitoring can detect individual cavity blockages or imbalances that would be invisible from machine data alone. One blocked cavity out of 32 means 3% scrap — which adds up fast at 500,000 cycles per year.
Tight-tolerance engineering plastics. Materials like PEEK, LCP, and glass-filled nylons have narrow processing windows. Cavity pressure monitoring catches viscosity shifts from lot-to-lot material variation before they produce out-of-spec parts.
Long production runs. The per-part cost of monitoring drops dramatically as volume increases. A $10,000 monitoring system amortized over 2 million parts adds half a cent per part — trivial compared to the cost of a single rejected shipment.
““Cavity pressure monitoring can detect individual cavity blockages in multi-cavity molds in real time.””Правда
Each sensor monitors its own cavity independently. A sudden pressure drop or complete absence of signal at one sensor location immediately flags a blocked or underfilled cavity, while neighboring cavities continue showing normal curves.
““Cavity pressure monitoring eliminates the need for post-molding quality inspection entirely.””Ложь
Cavity pressure catches process-related defects like short shots, sink marks, and dimensional variation. But it cannot detect cosmetic defects like color inconsistency, surface contamination, or assembly errors. Final visual and dimensional inspection remains necessary.
Каковы ограничения мониторинга давления в полости формы?
Cavity pressure monitoring is limited by sensor fragility, placement sensitivity, data overload, and inability to detect cosmetic defects. Here’s what the sensor vendors won’t tell you on the first call.
Sensors fail. Piezoelectric sensors in particular are fragile. A careless mold setter can destroy a $2,000 sensor during mold installation. Thermal cycling degrades sensor performance over thousands of cycles. You need a maintenance and recalibration plan — or you’ll be making decisions based on drifting data.
Placement is everything. A sensor in the wrong location gives you misleading data. Too close to the gate and you measure runner pressure, not cavity behavior. Too far from the last-to-fill point and you miss the most critical region. Most engineers place sensors at two locations: near the gate (to monitor injection and packing) and near the end of fill (to confirm complete filling).
Data overload is real. A single sensor generates thousands of data points per cycle. A 4-sensor mold running 24/7 produces terabytes per year. Without proper software to filter, trend, and alert, you end up with a massive database nobody looks at. The monitoring system is only as useful as the analytics behind it.
Cost adds up on multi-cavity molds. If each cavity needs its own sensor, a 16-cavity mold requires 32 sensors (gate + end-of-fill per cavity). At $1,500–$3,000 per channel, that’s $48,000–$96,000 in sensor hardware alone — before the monitoring system, cabling, and installation.
Not all defects are pressure-related. Color streaks, contamination, ejector pin marks, and mold surface defects have nothing to do with cavity pressure. Monitoring pressure won’t prevent these issues. It’s a powerful tool, but it’s one tool — not a complete quality system.
Bottom line: If you’re scrapping more than 2% of parts from process-related defects, cavity pressure monitoring usually pays for itself within 6–12 months. Start with one sensor on your highest-volume, tightest-tolerance mold. Prove the ROI on that tool, then scale.
If you are comparing vendors for a monitored production program, use our injection molding supplier sourcing guide to check process-control maturity, validation records, sensor maintenance discipline, and quality escalation rules before awarding the tool.
Часто задаваемые вопросы о мониторинге давления в полости формы
What is cavity pressure in injection molding?
Cavity pressure is the force per unit area exerted by the molten plastic inside the mold cavity during the injection, packing, and holding phases of the molding cycle. It is typically measured in bar or psi using pressure sensors embedded directly in the mold steel. This measurement reflects the actual conditions the material experiences inside the cavity — unlike machine-side pressure, which only shows what the injection unit is delivering from the nozzle. Cavity pressure directly influences part weight, dimensions, surface quality, and structural integrity of the final molded component.
How many cavity pressure sensors do I need per mold?
Most production applications use two sensors per cavity: one positioned near the gate to monitor injection and packing behavior, and one near the end of fill to confirm complete cavity filling. For simple parts with generous tolerances, a single sensor may suffice. For multi-cavity molds, a practical approach is to instrument representative cavities rather than every single one, then extrapolate the results. The exact number depends on part geometry complexity, tolerance requirements, your budget, and the level of quality documentation your customer or regulatory body demands.
What is the difference between cavity pressure and nozzle pressure?
Nozzle pressure is measured at the machine’s injection nozzle and reflects the screw’s output force during injection. Cavity pressure is measured inside the mold and reflects what the plastic actually experiences as it fills, packs, and cools in the cavity. The difference between the two represents pressure lost through the sprue, runner system, and gate. This pressure drop can be substantial — often 30–60% of nozzle pressure is consumed before the melt even enters the cavity, depending on runner length, diameter, and gate design.
Can cavity pressure monitoring detect weld line quality?
Yes, cavity pressure monitoring provides direct insight into weld line formation and strength. When two flow fronts meet inside the cavity, the pressure at the weld line location indicates how well the fronts fused together. Higher cavity pressure at the weld line means better molecular entanglement across the interface, resulting in stronger weld line strength. This is particularly valuable for structural parts where weld line integrity is a critical performance parameter and failure at the weld line could compromise the entire assembly.
What is scientific molding and how does cavity pressure relate to it?
Scientific molding is a data-driven methodology that decouples the injection molding process into four distinct phases — fill, pack, hold, and cool — and controls each one independently based on measurable variables rather than machine settings alone. Cavity pressure is the primary measurement variable in scientific molding because it directly reflects what the material is actually doing inside the mold. By monitoring cavity pressure at key locations, engineers can establish repeatable, transferable process parameters that produce consistent parts regardless of which machine or facility runs the mold.
How much does cavity pressure monitoring cost to implement?
A basic two-channel monitoring system — including cavity pressure sensors, charge amplifier or signal conditioner, data acquisition hardware, and basic analysis software — typically costs between $5,000 and $15,000 for a single-cavity application. For full production monitoring on a multi-cavity production mold with comprehensive analytics software, automated part diversion capabilities, and historical trending dashboards, costs can range from $30,000 to over $100,000. The total investment scales directly with the number of sensor channels, analytics platform sophistication, and factory integration requirements.
Can I retrofit cavity pressure sensors to an existing mold?
Yes, retrofitting is common and practical. Strain-gauge sensors mounted behind existing ejector pins are the most popular retrofit option because they require minimal mold modification — typically just drilling a pocket behind an existing pin and routing the cable through the ejector plate. Direct piezoelectric sensors are also possible for retrofits but require more extensive machining of the cavity steel to create a flush-mount pocket for the sensor diaphragm. The retrofit cost is significantly lower than building sensors into a new mold from scratch.
Does cavity pressure monitoring work with all plastic materials?
Cavity pressure monitoring works with all thermoplastic materials, from commodity resins like PP and PE to high-performance engineering plastics like polycarbonate, nylon, and PEEK. However, the pressure curve characteristics differ significantly between materials. Highly viscous materials like polycarbonate and PEEK generate higher fill pressures and different curve shapes compared to low-viscosity materials like polypropylene. The monitoring thresholds, tolerance bands, and golden curve parameters must be independently calibrated for each specific material and mold combination to provide meaningful process control data during production.
Готовы внедрить мониторинг давления в полости формы?
If you’re running precision parts with tight tolerances — especially in medical, automotive, or electronics — cavity pressure monitoring isn’t optional anymore. It’s how you move from “we think the process is good” to “we can prove every cycle met spec.”
In our factory, our engineers use process monitoring across the Shanghai facility because regulated clients demand documented, data-backed process control. With 400+ materials qualified and a 6-step quality control process from incoming inspection through outgoing verification, we understand that consistent quality starts with understanding what happens inside the mold.
Want to discuss cavity pressure monitoring for your next tooling project? Talk to an injection molding manufacturer — we’ll review your part geometry, tolerances, and production volume to recommend the right level of process monitoring for your application.
-
sink mark: sink mark refers to a surface depression on molded parts caused by insufficient packing pressure during the hold phase. ↩
-
injection mold: injection mold refers to a precision tool used in injection molding containing one or more cavities shaped to form plastic parts. ↩
-
piezoelectric sensor: piezoelectric sensor refers to a direct-contact pressure transducer that generates electrical charge proportional to applied melt pressure. ↩