Ir al contenido
El moldeo por inyección es un proceso cíclico — cada pieza nace de una secuencia repetitiva de inyección, empaque, enfriamiento y eyección. El tiempo total para un ciclo completo es el Duración del ciclo1, y controla directamente tu tasa de producción y costo por pieza. En nuestra fábrica de Shanghái, hemos pasado más de 20 años afinando tiempos de ciclo en miles de moldes. Esta guía desglosa el método de cálculo para que puedas estimar, medir y optimizar el tiempo de ciclo en tus propios proyectos.
- Tiempo de ciclo = inyección + empaquetado + enfriamiento + expulsión + apertura/cierre del molde
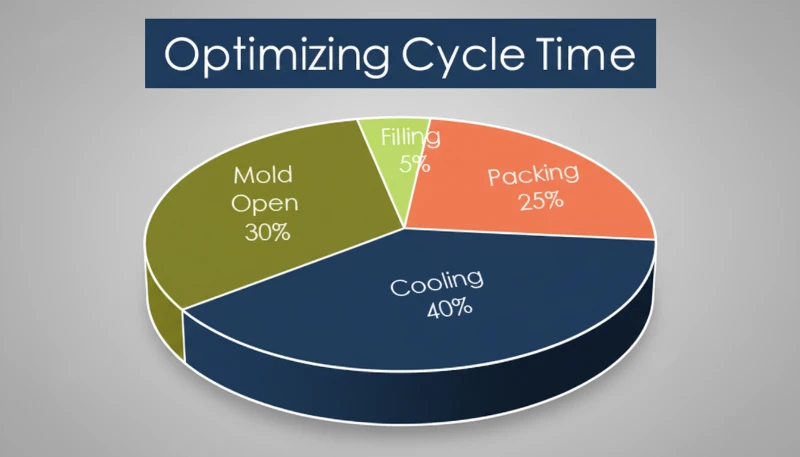
- El enfriamiento típicamente representa el 60–70% del tiempo total del ciclo
- El grosor de la pared es el factor más importante que determina la duración del enfriamiento
- Una reducción de 1 segundo puede producir más de 100.000 piezas adicionales por año en un molde multicavidad
- Un diseño adecuado de enfriamiento del molde es la optimización más rentable
¿Qué es el tiempo de ciclo en el moldeo por inyección?
El tiempo de ciclo es el tiempo total transcurrido desde el inicio de una inyección hasta el inicio de la siguiente. Mide qué tan rápido tu máquina puede producir piezas — y es la métrica más importante para molde de inyecciónaumentando la productividad.
Piénsalo de esta manera: si estás operando un molde de 4 cavidades con un ciclo de 30 segundos, eso es aproximadamente 480 piezas por hora. Redúcelo a 25 segundos y saltas a 576 — un aumento de producción del 20% sin inversión de capital adicional. Por eso los ingenieros experimentados se obsesionan con cada segundo.
La fórmula es sencilla en concepto: t_ciclo = t_inyección + t_empaque + t_enfriamiento + t_apertura + t_eyección + t_cierre. En la práctica, algunas fases se superponen. Recuperación del husillo2 (plastificación de la siguiente inyección) ocurre durante el enfriamiento, por lo que se toma el mayor entre t_enfriamiento y t_recuperación_husillo en lugar de sumar ambos.
El tiempo de ciclo no es una propiedad fija — cambia con el material, la geometría de la pieza, el diseño del molde y los ajustes de la máquina. Una tapa de PP de pared delgada podría ciclar en 5–8 segundos, mientras que una carcasa de policarbonato de pared gruesa podría tomar 60 segundos o más. Los ingenieros a menudo hablan del "tiempo de ciclo óptimo" — el ciclo repetible más rápido que aún produce piezas que cumplen con todas las especificaciones de calidad. Si se presiona demasiado rápido, se obtienen inyecciones cortas, marcas de hundimiento o desviación dimensional. Si se va demasiado lento, se pierde dinero en tiempo de máquina.
¿Cómo se calcula el tiempo de ciclo paso a paso?
La fórmula del tiempo de ciclo es la suma de los tiempos de inyección, empaquetado, enfriamiento y operación del molde. Algunas fases se superponen —por ejemplo, la recuperación del husillo ocurre durante el enfriamiento—, por lo que se toma la duración más larga en lugar de sumar ambas.
Tiempo de Inyección (t_inyección)
Este es el tiempo que tarda en llenarse la cavidad con plástico fundido. Para la mayoría de las piezas, es de 0,5 a 5 segundos. Se puede estimar como: t_inyección = Peso de la pieza (g) ÷ Tasa de inyección (g/s). Por ejemplo, una pieza de 50 g en una máquina que suministra 100 g/s tarda aproximadamente 0,5 segundos en llenarse. Pero los perfiles de inyección reales utilizan velocidades de múltiples etapas (lento-rápido-lento), por lo que el tiempo real es ligeramente superior al mínimo teórico.
Tiempo de Empaque/Mantenimiento (t_empaque)
Después de que la cavidad se llena, mantienes presión para compensar la contracción del material. Esto típicamente dura de 1 a 10 segundos dependiendo del espesor de pared y el tiempo de solidificación de la entrada. Las piezas delgadas se solidifican rápido; las gruesas necesitan más tiempo de mantenimiento. La fase de empaque termina cuando la entrada se solidifica, sellando la cavidad.
Tiempo de Enfriamiento (t_enfriamiento)
Aquí es donde vive la mayor parte de tu ciclo. Para materiales semicristalinos, Tiempo de enfriamiento3 es aproximadamente proporcional al cuadrado del grosor de la pared: t_enfriamiento ≈ C × (grosor de la pared)², donde C depende de la difusividad térmica del material y de la diferencia de temperatura entre el fundido y el molde. Para un grosor de pared de 3 mm en ABS, se esperan de 15 a 25 segundos. Para un grosor de 5 mm, salta a 40–60 segundos.
Apertura/cierre del molde y expulsión
La apertura y cierre del molde suele tardar de 2 a 10 segundos, dependiendo del tamaño del molde y de la tonelaje de la prensa. Los moldes pequeños en prensas de 80–200T tardan de 2 a 4 segundos; los moldes grandes en prensas de 500–1000T tardan de 6 a 12 segundos. El tiempo de expulsión añade de 0,5 a 3 segundos, siendo los extractores automatizados más rápidos que la extracción manual.
Resumiendo todo
Aquí hay un cálculo de ejemplo para una carcasa de ABS de tamaño mediano (pared de 3mm, 80g, molde de 4 cavidades en una prensa de 200T): t_inyección ≈ 1.5s, t_empaque ≈ 3s, t_enfriamiento ≈ 20s, t_apertura + t_eyección + t_cierre ≈ 5s. Tiempo total de ciclo: aproximadamente 29.5 segundos. En producción, hemos visto ciclos desde 5 segundos para empaques de pared delgada hasta más de 90 segundos para piezas técnicas gruesas.
¿Cuáles son las cuatro fases de un ciclo de moldeo por inyección?
Las cuatro fases son inyección (llenado), empaque (mantenimiento), enfriamiento y eyección/reinicio. Cada una tiene un papel distinto en la calidad de la pieza y la eficiencia del ciclo.
Fase 1 — Inyección (Llenado)
El tornillo avanza, forzando plástico fundido a través del canal y la entrada hacia la cavidad. La velocidad es crítica — demasiado lenta y el fundido se solidifica antes de llenar; demasiado rápida y se produce chorreo o rebaba. El tiempo de inyección es típicamente la fase más corta, pero establece la base para la calidad de la pieza.
Fase 2 — Empaquetado (Mantenimiento)
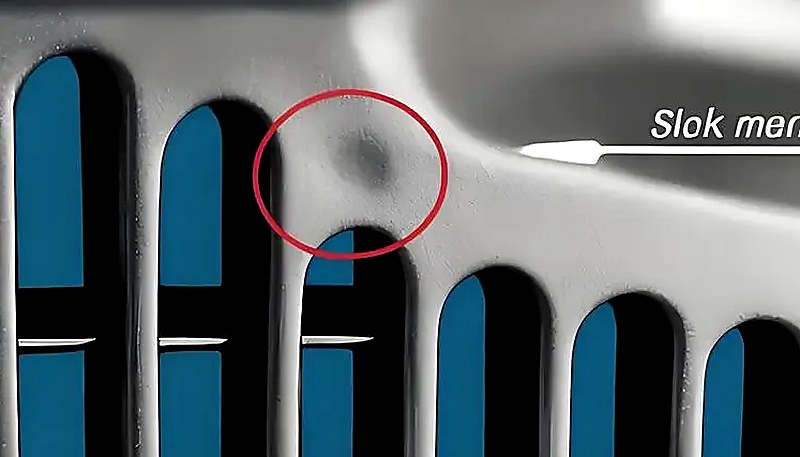
Una vez que la cavidad está llena volumétricamente, la máquina cambia a presión de mantenimiento. Esta presión adicional empaqueta material extra para compensar la contracción térmica a medida que la pieza se enfría. El empaquetado continúa hasta que la entrada se congela, sellando la cavidad. Calcular mal el tiempo de empaquetado es una causa común de marcas de hundimiento y huecos.
Fase 3 — Enfriamiento
El molde mantiene una temperatura controlada (generalmente 20–80°C dependiendo del material), extrayendo calor de la pieza hasta que es lo suficientemente rígida para eyectar sin deformación. Esta fase es la más larga — a menudo 60–70% del tiempo total de ciclo. Mientras tanto, el tornillo retrocede y plastifica el siguiente disparo, por lo que el enfriamiento y la recuperación del tornillo se superponen.
Fase 4 — Expulsión y reinicio
El molde se abre, la pieza es eyectada (mecánicamente o por robot), y el molde se cierra para el siguiente disparo. La eyección puede ser un cuello de botella si las piezas se pegan o si se requiere inspección manual. Sistemas de eyección bien diseñados y ángulos de desmoldeo adecuados mantienen esta fase predecible.
En nuestra fábrica de Shanghái, operamos 47 máquinas de moldeo por inyección de 90T a 1850T. Con más de 20 años de experiencia en producción en más de 400 materiales, hemos optimizado tiempos de ciclo desde piezas de empaque de PP de ciclo rápido en 8 segundos hasta componentes de PC de pared gruesa en 60+ segundos. Cada máquina registra datos de ciclo disparo a disparo para la mejora continua.
¿Por qué domina el tiempo de enfriamiento el ciclo?
El enfriamiento es la fase dominante, consumiendo 60–70% del tiempo total de ciclo porque la extracción de calor de paredes gruesas de polímero toma más tiempo que cualquier otro paso.
El polímero fundido entra en la cavidad a 200–300°C y debe enfriarse a 40–80°C antes de que sea seguro expulsarlo. La tasa de transferencia de calor depende de varios factores.
Espesor de pared — El factor clave
El tiempo de enfriamiento escala aproximadamente con el cuadrado de la sección más gruesa. Una pieza de 4 mm de espesor necesita aproximadamente 1,8× el tiempo de enfriamiento de una pieza de 3 mm. Por eso las revisiones de DFM siempre impulsan un espesor de pared mínimo uniforme.
Conductividad térmica del material
Los materiales amorfos como el PC y el ABS se enfrían de manera diferente a los semicristalinos como el PA y el POM. Los materiales cristalinos liberan calor latente durante la solidificación, lo que añade tiempo de enfriamiento. La elección del material no solo se trata del rendimiento de la pieza — impacta directamente en la economía de producción.
Temperatura del Molde y Diseño de Canales de Enfriamiento
Una temperatura del molde más baja extrae el calor más rápido, pero demasiado frío provoca tensiones residuales, deformaciones o un acabado superficial deficiente. Los circuitos de deflectores bien colocados, los tubos de calor o los canales de enfriamiento conformados pueden reducir el tiempo de enfriamiento entre un 20 y un 40% en comparación con los canales perforados básicos. Aquí es donde la ingeniería de moldes se amortiza.

La implicación práctica: si quieres reducir el tiempo del ciclo, ataca primero el enfriamiento. Un espesor de pared uniforme (mantén las variaciones por debajo del 25%), una disposición optimizada de los canales de enfriamiento y caudales de agua adecuados ofrecen los mayores beneficios.
¿Qué factores impactan más en el tiempo de ciclo?
Los factores más importantes son el espesor de pared, las propiedades térmicas del material, el diseño de enfriamiento del molde y la capacidad de la máquina — aproximadamente en ese orden.
La geometría de la pieza es el principal factor. Paredes más gruesas significan un enfriamiento exponencialmente más largo. Geometrías complejas con nervaduras profundas, refuerzos o secciones de espesor variable crean puntos calientes que obligan a extender todo el ciclo para el área que más tarda en enfriarse.
La selección del material importa porque diferentes polímeros tienen diferentes propiedades térmicas. El PP y el PE se enfrían relativamente rápido. El PC, el PPSU y los nailon reforzados necesitan más tiempo. Si el tiempo de ciclo es crítico y el rendimiento lo permite, cambiar de PC a ABS puede reducir el enfriamiento entre un 30 y un 40%.
El diseño del molde es donde se gana o se pierde. Los factores clave incluyen la ubicación y el caudal de los canales de enfriamiento, el tipo y ubicación de la entrada, la fiabilidad del sistema de expulsión y la selección del material del molde. Los insertos de cobre-berilio conducen el calor de 3 a 5 veces más rápido que el acero y son excelentes para áreas de puntos calientes. Los ajustes de la máquina ofrecen ganancias incrementales: una mayor velocidad de inyección, perfiles de mantenimiento optimizados y velocidades de apertura/cierre del molde más rápidas ayudan, pero son ajustes finos en comparación con el diseño y la ingeniería del molde.
“El tiempo de enfriamiento suele representar entre el 60 y el 70% del tiempo total del ciclo de moldeo por inyección.”Verdadero
Correcto. En miles de series de producción en nuestra fábrica, el enfriamiento domina consistentemente el ciclo. Incluso en moldes de envasado de ciclo rápido, el enfriamiento sigue siendo la fase individual más larga.
"Aumentar la velocidad de inyección siempre reduce el tiempo total del ciclo."Falso
Falso. Más allá de un punto óptimo, una inyección más rápida provoca rebabas, chorreo o atrapamiento de aire que requieren un tiempo de empaquetado y enfriamiento prolongado para solucionarlo. El tiempo neto del ciclo puede aumentar en realidad si se lleva la velocidad de inyección demasiado lejos.
¿Cómo Puedes Optimizar el Tiempo de Ciclo Sin Sacrificar la Calidad?
Enfóquese primero en la optimización del enfriamiento, luego en la reducción del espesor de pared y luego en el ajuste de la máquina — en ese orden de impacto. Aquí están las estrategias más efectivas que usamos en producción.
Rediseñar los Canales de Enfriamiento
Este es el cambio de mayor ROI. Si tu molde tiene canales básicos rectos perforados, cambiar a deflectores, burbujeadores o canales en espiral puede reducir el tiempo de enfriamiento entre un 15 y un 30%. Para moldes de alto volumen, el enfriamiento conformado (posible gracias a la impresión 3D en metal) puede lograr reducciones del 40% o más.
Minimizar y Uniformizar el Espesor de Pared
Cada reducción de 0.5 mm en el espesor máximo de pared puede reducir el tiempo de enfriamiento entre un 10 y un 20%. Mantenga la variación del espesor de pared por debajo del 25% en toda la pieza. Trabaje con su equipo de diseño desde el principio: los cambios de DFM son económicos antes de cortar el molde, costosos después.
Optimizar la Ubicación y Tipo de Entrada
Una mejor ubicación de la compuerta asegura un llenado uniforme y reduce la necesidad de un tiempo de empaquetado prolongado. Los sistemas de canal caliente con compuertas de válvula permiten un ciclado más rápido porque sellan independientemente de la fase de enfriamiento.
Automatizar la Expulsión
Los recolectores robóticos o los sistemas de caída automática eliminan la variabilidad de la extracción manual de piezas. Esto es especialmente impactante para ciclos inferiores a 15 segundos, donde el tiempo de respuesta humano se convierte en un cuello de botella.
La advertencia: cualquier optimización del tiempo de ciclo debe validarse con datos de calidad. Si observas marcas de hundimiento, desviaciones dimensionales o deformaciones después de reducir el tiempo del ciclo, has ido demasiado lejos. Realiza siempre un estudio de capacidad (Cpk) antes de fijar un nuevo ciclo. Para orientación sobre cómo elegir el socio de fabricación adecuado para una producción optimizada, consulta nuestro injection molding sourcing guide.
"Una reducción de 1 segundo en el tiempo del ciclo en un molde de 4 cavidades que opera 24/7 puede producir más de 100,000 piezas adicionales al año."Verdadero
Correcto. Reducir un ciclo de 30 segundos a 29 segundos aumenta la producción en aproximadamente 145.000 piezas al año en un molde de 4 cavidades funcionando continuamente. Incluso pequeñas optimizaciones se acumulan significativamente en la producción de alto volumen.
"Usar una temperatura de molde más alta siempre mejora la calidad de la pieza y vale la pena el aumento del tiempo del ciclo."Falso
Falso. Aunque una temperatura de molde más alta puede reducir la tensión residual y mejorar el acabado superficial, también prolonga el tiempo de enfriamiento y puede causar una contracción excesiva. La temperatura óptima del molde es un equilibrio entre los requisitos de calidad y la eficiencia del ciclo, no una simple regla de 'más caliente es mejor'.
¿Cuáles Son los Tiempos de Ciclo Típicos para Materiales Comunes?
Los tiempos de ciclo varían ampliamente, pero aquí hay rangos típicos basados en datos de producción real para una pieza de complejidad media con paredes de 2–3 mm. Estos rangos asumen un molde estándar con enfriamiento adecuado.
| Material | Ciclo Típico (segundos) | Notas clave |
|---|---|---|
| PP (polipropileno) | 8–25 | Enfriamiento rápido, baja viscosidad — ideal para envases |
| PE (polietileno) | 8–20 | Similar al PP, buenas características de flujo |
| ABS | 15–40 | Enfriamiento moderado, plástico de ingeniería versátil |
| PS (Poliestireno) | 10–25 | Congelación rápida pero frágil — requiere una expulsión cuidadosa |
| PC (policarbonato) | 25–60 | Alta temperatura de fusión, enfriamiento lento |
| PA6 (Nailon 6) | 15–45 | Semicristalino, necesita un enfriamiento exhaustivo |
| PA66 (Nylon 66) | 18–50 | Mayor cristalinidad que el PA6, enfriamiento más largo |
| POM (Acetal) | 15–35 | Buenas propiedades térmicas, cristalización rápida |
| TPU | 20–45 | Material flexible, se requiere expulsión más lenta |
| PBT | 15–35 | Cristalización rápida, buena para piezas eléctricas |
Con canales de enfriamiento conformados optimizados, a menudo se puede operar entre un 20 y un 30% más rápido que estos rangos. La conclusión: la elección del material no solo se trata del rendimiento de la pieza, sino que impacta directamente en la economía de producción a través del tiempo del ciclo.
¿Cómo se mide y monitorea el tiempo de ciclo en producción?
La medición del tiempo de ciclo se realiza mediante el temporizador integrado de la máquina y luego se rastrea con software SPC para detectar la deriva del proceso de manera temprana.
Monitoreo a Nivel de Máquina
Cada prensa moderna muestra el tiempo de ciclo en tiempo real. La mayoría puede registrar datos ciclo por ciclo y alertar a los operadores cuando un ciclo excede el límite establecido. Esta es su primera línea de defensa: si la máquina indica 32 segundos y usted ha establecido un objetivo de 30 segundos, algo necesita atención.
Tendencias SPC y Detección de Deriva
Rastree el tiempo de ciclo a lo largo de cientos o miles de disparos. Una tendencia gradual al alza a menudo indica un problema en desarrollo: canales de enfriamiento sucios, pasadores eyectores desgastados o cambios en la viscosidad del material. Detectar estos problemas temprano evita problemas de calidad y tiempos de inactividad no planificados.
Causas Comunes de la Deriva del Tiempo de Ciclo
Los sospechosos habituales incluyen la acumulación de incrustaciones en los canales de enfriamiento (reduce la transferencia de calor), boquillas de canal caliente desgastadas (llenado más lento, empaquetado más largo), variación de lote a lote del material, degradación del sistema hidráulico en máquinas antiguas y cambios de temperatura ambiente entre estaciones.
Nuestra recomendación: establezca un límite de control superior (UCL) para el tiempo de ciclo en un 5% por encima de su ciclo optimizado. Cualquier disparo que exceda el UCL debe desencadenar una investigación. Esta simple regla detecta el 80% de los problemas en desarrollo antes de que produzcan piezas defectuosas. Para operaciones serias, los MES (Sistemas de Ejecución de Fabricación) integran los datos del tiempo de ciclo con los resultados de inspección de calidad, permitiéndole correlacionar las variaciones del ciclo con la calidad de la pieza en tiempo real.
Preguntas frecuentes
¿Cuál es la fórmula para el tiempo de ciclo del moldeo por inyección?
La fórmula básica es t_ciclo = t_inyección + t_empaque + t_enfriamiento + t_apertura + t_eyección + t_cierre. Sin embargo, algunas fases se superponen —especialmente el enfriamiento y la recuperación del tornillo—. Se toma el tiempo mayor de los dos en lugar de sumar ambos. Para una estimación rápida, el tiempo de enfriamiento suele ser del 60–70% del total, así que medir la duración del enfriamiento y multiplicarla por 1.4–1.6 da una aproximación razonable. Siempre valide con datos reales de la máquina, ya que los tiempos de ciclo en el mundo real dependen de la geometría de la pieza, el material y el diseño del molde.
¿Cuántos segundos dura un ciclo típico de moldeo por inyección?
La mayoría de los ciclos de moldeo por inyección oscilan entre 10 y 60 segundos. Las piezas de empaque de pared delgada como tapas de botellas pueden ciclar en 5-8 segundos en máquinas de alta velocidad optimizadas. Las piezas técnicas estándar con paredes de 2-3 mm suelen funcionar entre 15-30 segundos en prensas convencionales. Las piezas de pared gruesa o materiales de alto rendimiento como el policarbonato pueden llegar a 45-90 segundos debido a los requisitos de enfriamiento prolongado. El ciclo específico depende en gran medida del espesor de la pared, las propiedades térmicas del material, la capacidad de enfriamiento del molde y la complejidad de la pieza. Si está funcionando consistentemente por encima de 60 segundos, investigue la optimización del enfriamiento.
¿Cuál es la fase más larga en el moldeo por inyección?
El enfriamiento es casi siempre la fase más larga, consumiendo del 60-70% del tiempo total del ciclo en la mayoría de los escenarios de producción. Esto se debe a que debes extraer suficiente calor del polímero fundido para que la pieza sea lo suficientemente rígida para la expulsión sin deformación. La termodinámica es inevitable: el tiempo de enfriamiento escala aproximadamente con el cuadrado del espesor de la pared, lo que significa que incluso pequeños aumentos en el grosor de la pieza extienden dramáticamente el ciclo total. En piezas de empaque de pared delgada, el tiempo de inyección puede ser significativo, pero el enfriamiento aún domina la gran mayoría de las corridas de producción.
¿Cómo afecta el grosor de la pared el tiempo de ciclo?
El espesor de pared es el factor más importante que determina el tiempo de ciclo porque el tiempo de enfriamiento escala aproximadamente con el cuadrado del espesor de pared. Duplicar el espesor de la pared cuadruplica aproximadamente el tiempo de enfriamiento requerido. Por ejemplo, una pieza con una pared de 2 mm podría necesitar 8 segundos de enfriamiento, mientras que la misma geometría a 4 mm requiere 25-30 segundos. Esta relación exponencial es la razón por la cual las revisiones de diseño para fabricación siempre impulsan un espesor de pared mínimo uniforme. Cualquier sección significativamente más gruesa que el resto se convierte en el cuello de botella para todo el ciclo, forzando un enfriamiento prolongado para todas las cavidades.
¿Se puede reducir el tiempo de ciclo sin cambiar el molde?
Sí, puedes reducir el tiempo de ciclo sin cambios en el molde, pero las mejoras son menores en comparación con las modificaciones a nivel de molde. Las optimizaciones del lado de la máquina incluyen aumentar la velocidad de inyección, ajustar los perfiles de presión de mantenimiento, garantizar un caudal y temperatura óptimos del agua de refrigeración, y cambiar a un grado de material de ciclo más rápido. Estos ajustes suelen producir mejoras del 5-15% en el tiempo de ciclo. Para mejoras mayores del 20-40% o más, generalmente necesitas modificaciones en el molde, como canales de refrigeración mejorados, inserciones de cobre berilio en áreas de puntos calientes o rediseño de la compuerta para un llenado más eficiente.
¿Cuál es la diferencia entre el tiempo de ciclo y el tiempo de entrega en la inyección de plásticos?
El tiempo de ciclo mide la velocidad de producción: el tiempo de un ciclo de máquina de disparo a disparo. El tiempo de entrega es el tiempo total desde la colocación del pedido hasta la entrega, incluyendo la fabricación de herramientas, la adquisición de materiales, la programación de producción, la inspección de calidad y el envío. Una pieza con un tiempo de ciclo de 20 segundos podría tener un tiempo de entrega de 4 a 6 semanas para un molde nuevo, o de 3 a 5 días para una corrida de producción repetida. Comprender ambas métricas es esencial para la planificación del proyecto: los tiempos de ciclo rápidos no ayudan si el molde no está listo.
¿Cómo se calcula el tiempo de enfriamiento en el moldeo por inyección?
Una estimación simplificada del tiempo de enfriamiento utiliza la fórmula t_enfriamiento = (espesor al cuadrado multiplicado por factor_térmico) dividido por difusividad_térmica, donde el factor térmico depende de la diferencia de temperatura entre la temperatura de fusión y la temperatura del molde. En la práctica, la mayoría de los ingenieros confían en datos empíricos de producción o software de simulación de moldes como Moldflow porque las geometrías reales de las piezas son demasiado complejas para cálculos manuales precisos. Como regla práctica, para una pared de 3 mm en material amorfo como ABS, espere 15-25 segundos. Para el mismo espesor en nailon semicristalino, agregue un 20-30% más de tiempo de enfriamiento.
¿Por qué varía mi tiempo de ciclo de disparo a disparo?
Una variación menor del tiempo de ciclo de más o menos 0.5-1 segundo es completamente normal y resulta de ligeras diferencias en la consistencia de alimentación del material, la repetibilidad de la posición del husillo y la respuesta del sistema hidráulico. Variaciones mayores que exceden los 2 segundos generalmente indican un problema real: secado inconsistente del material, canales de enfriamiento obstruidos o con incrustaciones, un anillo de retención desgastado que causa variación en el tamaño del disparo o sensores de temperatura defectuosos. Si observa una tendencia gradual al alza a lo largo de cientos de disparos, verifique primero el caudal de agua de enfriamiento porque la acumulación de incrustaciones minerales dentro de los canales es la causa más común de la deriva lenta del tiempo de ciclo.
¿Listo para Optimizar tu Tiempo de Ciclo de Moldeo por Inyección?
El equipo de ingeniería de ZetarMold tiene más de 20 años de experiencia optimizando ciclos de producción en más de 400 materiales. Para obtener una descripción general detallada de las capacidades, consulta nuestro complete guide to injection molding. Desde la revisión del diseño del molde hasta el ajuste de producción, lo ayudamos a lograr el ciclo más rápido sin comprometer la calidad. Solicite un presupuesto gratuito para su próximo proyecto.
-
Tiempo de ciclo: El tiempo de ciclo se refiere al tiempo total transcurrido desde el inicio de un ciclo de producción hasta el inicio del siguiente en un proceso de fabricación repetitivo. ↩
-
Recuperación del husillo: La recuperación del husillo se refiere a la fase en la que el husillo de inyección gira para plastificar y acumular el siguiente disparo de material mientras la pieza anterior se enfría en el molde. ↩
-
Tiempo de enfriamiento: El tiempo de enfriamiento se refiere a la duración requerida para reducir la temperatura de un polímero moldeado desde su temperatura de fusión hasta una temperatura de expulsión segura dentro de la cavidad del molde. ↩