Zum Inhalt springen
Every injection molding factory has a carbon problem — whether you measure it or not. Machine presses consume enormous energy, thermoplastic pellets come from fossil fuels, and scrap rates quietly pile up in landfills. The question is not whether your Spritzgießen operation has a Carbon Footprint1, but how large it is and what you can realistically do to shrink it.
- Injection molding energy consumption ranges from 1.5 to 5.5 kWh per kg of processed polymer
- Machine heating and cooling cycles account for 60–70% of total plant energy use
- Material selection alone can cut embodied carbon by 40–60%
- Regenerative machine drives recover up to 25% of braking energy
- Recycled content at 30% blend reduces cradle-to-gate emissions by roughly one-third
What Contributes to the Carbon Footprint in Injection Molding?
Machine energy is the largest contributor to the carbon footprint, followed by material embodied carbon and production waste. A comprehensive Spritzgussform lifecycle assessment reveals that machine energy often dominates, but for certain materials, the feedstock carbon overshadows everything else.
Energy use in injection molding is not constant — it spikes during plasticizing and injection phases, drops during holding and cooling. The barrel heaters on a typical 200-ton hydraulic press draw 15–25 kW continuously just to maintain melt temperature, whether the machine is cycling or sitting idle between shots. That baseline load is the hidden carbon cost most factories overlook.
| Source | Typical Share | Primary Drivers |
|---|---|---|
| Machine energy (electricity) | 40–60% | Barrel heating, hydraulic pumps, clamping force |
| Raw material embodied carbon | 25–40% | Polymer type, virgin vs recycled content |
| Hilfsausrüstung | 10–15% | Dryers, chillers, conveyors, robots |
| Waste & scrap handling | 5–10% | Reject rate, regrind practices, disposal method |
| Facility overhead | 5–8% | Lighting, HVAC, compressed air |
“Reducing cycle time directly reduces per-part carbon emissions in injection molding.”Wahr
Shorter cycles mean the machine spends less energy per part on clamping, holding, and barrel heating. Cycle time optimization through scientific molding is one of the most direct and cost-effective carbon reduction strategies available.
“Switching to all-electric machines eliminates most of the carbon footprint of injection molding.”Falsch
All-electric machines reduce energy consumption by 40–60%, but raw material embodied carbon and auxiliary systems still account for a significant share. A holistic approach addressing materials, processes, and infrastructure is necessary for meaningful carbon reduction.
How Do You Measure Carbon Emissions in Injection Molding?
The standard way to measure injection molding carbon emissions is a Life Cycle Assessment2 (LCA) scoped cradle-to-gate. This covers material production, transport, and your manufacturing process as the practical starting point, following ISO 14040/14044 frameworks.
Start by measuring Scope 1 Emissions3 (on-site natural gas for dryers, forklift fuel) and Scope 2 emissions (purchased electricity powering machines). Your electricity bill divided by production volume gives you a rough specific energy consumption figure. Cross-reference that with your regional grid emission factor — a factory running the same machines in Norway (0.02 kg CO2/kWh) and China (0.55 kg CO2/kWh) has drastically different footprints.
In practice, we recommend tracking three core metrics monthly: specific energy consumption (kWh/kg), scrap rate (%), and material embodied carbon (kg CO2/kg polymer). These three numbers tell you most of the story and give you clear improvement targets.
Which Injection Molding Materials Have the Highest Carbon Footprint?
Not all plastics are created equal when it comes to carbon. The embodied carbon of common injection molding resins varies dramatically — from roughly 2 kg CO2/kg for polypropylene to over 9 kg CO2/kg for carbon-fiber-reinforced nylon. The feedstock source (petroleum vs bio-based), the polymerization process energy, and any additives or fillers all contribute.
| Material | Approx. kg CO2/kg | Anmerkungen |
|---|---|---|
| PP (Polypropylen) | 1.8–2.5 | Lowest common thermoplastic; widely recyclable |
| PE (Polyethylen) | 1.8–2.8 | LDPE slightly higher than HDPE due to process energy |
| PS (Polystyrol) | 2,5–3,5 | General purpose; EPS foam has additional blowing agents |
| PVC (Polyvinylchlorid) | 2.0–3.0 | Lower feedstock carbon, but chlorine processing adds complexity |
| ABS | 3.0–4.0 | Three-monomer system increases processing energy |
| PA6/PA66 (Nylon) | 5.0–7.0 | Energy-intensive polymerization; caprolactam production is carbon-heavy |
| PC (Polycarbonat) | 6.0–8.0 | Phosgene-based process; high energy and chemical inputs |
| PEEK | 25–35 | Ultra-high processing temperatures compound the footprint |
| CF-reinforced PA | 8.0–12.0 | Carbon fiber production is extremely energy-intensive (~20 kg CO2/kg fiber) |
When we evaluate material substitutions at our Shanghai facility, we look beyond the per-kilogram number. A higher-performing polymer might let you reduce wall thickness by 20%, using less total material and offsetting the higher per-kg footprint. The functional unit matters — compare footprint per finished part, not per kilogram of resin.
How Can Machine Selection Reduce Your Carbon Footprint?
The single biggest lever most molders can pull is switching from hydraulic to all-electric machines. A typical hydraulic 200-ton press consumes 30–50% more energy than an equivalent all-electric machine producing the same parts. The reason is straightforward: hydraulic pumps run continuously, generating heat that must then be removed by cooling systems — a double energy penalty.
All-electric machines use servo motors that only draw power during active movements. When the clamp is holding, the motor brakes and feeds energy back into the system. Independent studies show specific energy consumption improvements of 40–60% when replacing old hydraulic machines with modern electric presses.
“Hot runner systems reduce carbon footprint by eliminating cold runner scrap.”Wahr
Hot runners eliminate the cold runner waste stream entirely, saving both raw material and the energy needed to regrind and reprocess it. For high-volume multi-cavity tools, the material and energy savings are substantial.
“Using 100% recycled plastic always produces a lower carbon footprint than virgin material.”Falsch
While mechanical recycling typically saves 70–85% of production energy, some recycled streams require extensive sorting, washing, and reprocessing that reduce the net benefit. Post-industrial regrind used in-house has the best carbon profile.
What Process Optimization Strategies Lower Carbon Emissions?
Cycle time optimization is the most effective process-level carbon reduction strategy. Scientific molding techniques that identify the minimum viable cooling time typically cut cycles by 10–25% without sacrificing part quality. Every second of cooling time you eliminate is a second where the machine is not consuming energy for clamp holding and barrel maintenance.
Melt temperature management is another overlooked area. Many molders run barrel temperatures 10–20°C higher than necessary because it was the setting inherited from the last job. Each degree of unnecessary melt temperature adds roughly 1% to barrel energy consumption. Dialing in the correct melt temperature for the specific grade reduces energy, shortens cooling time, and often improves part appearance.
Hot runner systems, when properly balanced, reduce material waste by eliminating cold runners entirely. Conformal cooling channels in molds, enabled by metal 3D printing, can reduce cycle times by 20–40%, with proportional energy and carbon reductions.
How Does Recycled Content Affect the Carbon Footprint?
Incorporating post-industrial or post-consumer recycled (PCR) content is one of the most effective carbon reduction strategies. Mechanical recycling of common thermoplastics like PP, PE, and PET typically uses 70–85% less energy than virgin production, because you skip the energy-intensive polymerization step entirely. For a 30% recycled content blend in PP, you can expect roughly a 25–30% reduction in material-related carbon emissions.
The practical challenge is maintaining mechanical properties and color consistency. At our factory, we routinely run PP with 20–30% post-industrial regrind for non-critical applications like packaging inserts and internal brackets. For visible or structural parts, we validate recycled blends through our standard quality control process before committing to production volumes.
A note of caution: not all recycled content delivers equal carbon benefits. If the recycled material requires additional sorting, washing, and re-pelletizing steps that consume significant energy, the net benefit shrinks. Post-industrial regrind used in-house at the point of generation has the lowest carbon overhead of any recycled stream.
What Role Does Factory Infrastructure Play in Carbon Reduction?
Compressed air systems, cooling infrastructure, and facility lighting are the three biggest factory-level carbon reduction levers. Compressed air systems are notoriously inefficient — typically only 10–20% of input energy reaches the point of use. Every air leak, undersized pipe, and unnecessary blowdown adds to your carbon bill. A systematic compressed air audit often identifies 20–30% savings potential with low-cost fixes.
Cooling infrastructure is another major factor. Central chiller systems serving multiple machines are more efficient per ton of refrigeration than individual mold temperature controllers, but only if the distribution loop is properly insulated and the chiller is sized correctly for the actual load.
Lighting upgrades to LED, motion sensors in low-traffic warehouse areas, and variable-frequency drives on HVAC motors are not glamorous, but together they typically trim 5–10% off total facility energy. For a factory running 47 injection molding machines, that represents meaningful tonnage of CO2 avoided.
“LED lighting and variable-frequency drives on HVAC motors can reduce facility overhead energy by 5–10%.”Wahr
While individual savings are modest, these infrastructure improvements compound across a large factory. For a facility with 47 injection molding machines, 5–10% overhead reduction translates to hundreds of tonnes of CO2 avoided annually.
“ISO 14001 certification guarantees a low carbon footprint for a molding factory.”Falsch
ISO 14001 certifies that an environmental management system exists and is followed — it does not set specific carbon performance thresholds. A certified factory may still have a high absolute footprint; certification ensures continuous measurement and improvement, not a particular performance level.
How Can You Build a Carbon Reduction Roadmap for Your Molding Operation?
A three-phase roadmap is the most practical approach: baseline measurement, process optimization, then structural investment. Phase 1 (0–6 months) starts with installing sub-meters on major machines, tracking specific energy consumption by press, and quantifying scrap rates. Quick wins include shutting down idle machines, reducing barrel set temperatures, and fixing compressed air leaks — these cost almost nothing and typically deliver 5–15% energy savings.
Phase 2 (6–18 months): Invest in process optimization. Implement scientific molding to minimize cycle times on your highest-volume tools. Evaluate hot runner conversions for multi-cavity molds still using cold runners. Begin qualifying recycled material blends for non-critical parts. Replace the oldest, most energy-hungry hydraulic machines with all-electric alternatives.
| Phase | Zeitleiste | Key Actions | Expected Impact |
|---|---|---|---|
| 1 — Baseline & Quick Wins | 0–6 months | Sub-metering, idle shutdown, air leak fixes, temperature optimization | 5–15% energy reduction |
| 2 — Process Optimization | 6–18 months | Scientific molding, hot runners, recycled blends, machine upgrades | 15–35% zusätzliche Reduktion |
| 3 — Strukturelle Veränderung | 18–36 Monate | Erneuerbare Energie, biobasierte Materialien, ISO 14001, vollständige Rückverfolgbarkeit | 30–50% Gesamtreduktionsziel |
Phase 3 (18–36 Monate): Strukturelle Veränderungen. Bewerten Sie Solar- oder erneuerbare Energie vor Ort sourcing guide. Untersuchen Sie biobasierte Polymeralternativen für geeignete Produktlinien. Implementieren Sie eine vollständige Materialrückverfolgbarkeit, um Angaben zum Recyclinganteil zu unterstützen. Erwägen Sie die ISO 14001-Zertifizierung als Rahmen für kontinuierliche Umweltverbesserungen. Bei ZetarMold bieten unsere ISO 14001- und ISO 45001-Zertifizierungen die Governance-Struktur, um unsere Umweltleistung systematisch zu verfolgen und zu verbessern.
Frequently Asked Questions About Carbon Footprint in Injection Molding
Wie viel CO2 produziert eine Spritzgießmaschine pro Stunde?
Eine typische 200-Tonnen hydraulische Spritzgießmaschine verbraucht 25–40 kWh pro Stunde. Unter Verwendung des globalen durchschnittlichen Netz-Emissionsfaktors von etwa 0,46 kg CO2/kWh entspricht das 11,5–18,4 kg CO2 pro Stunde. Eine vergleichbare vollelektrische Maschine würde etwa 5–9 kg CO2 pro Stunde produzieren.
Wie groß ist der CO2-Fußabdruck von einem Kilogramm spritzgegossener PP-Teile?
Für Polypropylen beträgt der eingebettete Kohlenstoff im Harz etwa 1,8–2,5 kg CO2/kg. Die Zugabe von Prozessenergie von etwa 1,5–3,0 kWh/kg bringt den Gesamtwert auf etwa 2,5–4,0 kg CO2 pro kg fertiger PP-Teile. Die Verwendung von recyceltem PP kann dies um 25–40% reduzieren.
Ist Spritzgießen CO2-intensiver als andere Fertigungsverfahren?
Im Vergleich zur CNC-Bearbeitung ist das Spritzgießen pro Teil bei Stückzahlen über 1.000 typischerweise weniger kohlenstoffintensiv, da der Materialabfall deutlich geringer ist. Im Vergleich zum 3D-Druck (FDM/SLA) ist das Spritzgießen in großem Maßstab deutlich effizienter.
Kann erneuerbare Energie die CO2-Emissionen beim Spritzgießen vollständig eliminieren?
Erneuerbarer Strom kann Scope-2-Emissionen eliminieren, die typischerweise 40–60% des CO2-Fußabdrucks einer Anlage ausmachen. Der eingebettete Kohlenstoff in Polymerrohstoffen (Scope 3 upstream) bleibt jedoch bestehen, es sei denn, man wechselt zu biobasierten oder vollständig recycelten Materialien.
Wie viel Prozent des Spritzgießabfalls kann recycelt werden?
Thermoplastischer Spritzgießabfall – Kaltkanäle, Kurzschüsse und fehlerhafte Teile – ist zu fast 100% durch mechanisches Zermahlen recycelbar. Die praktische Grenze liegt üblicherweise bei etwa 20–30% Rezyklatanteil in der Beschickungsmischung, um konsistente mechanische Eigenschaften zu erhalten.
Wie beeinflusst die Wandstärke den CO2-Fußabdruck bei spritzgegossenen Teilen?
Dickere Wände erfordern mehr Material pro Teil und längere Abkühlzeiten. Eine Reduzierung der Wandstärke um 20% kann den Material-CO2-Ausstoß pro Teil um etwa 20% und die Zykluszeit um 15–30% senken, mit zusätzlichen Energieeinsparungen.
Welche Zertifizierungen helfen bei der Überprüfung der CO2-Reduzierung beim Spritzgießen?
ISO 14001 bietet den Rahmen für das Umweltmanagement. ISO 14067 spezifiziert die Methodik zur Berechnung des Produkt-CO2-Fußabdrucks. Für materialspezifische Angaben kann der Recyclinganteil durch GRS (Global Recycled Standard) oder SCS Recycled Content-Zertifizierung verifiziert werden.
Beeinflusst der Formenbau den CO2-Fußabdruck der Produktion?
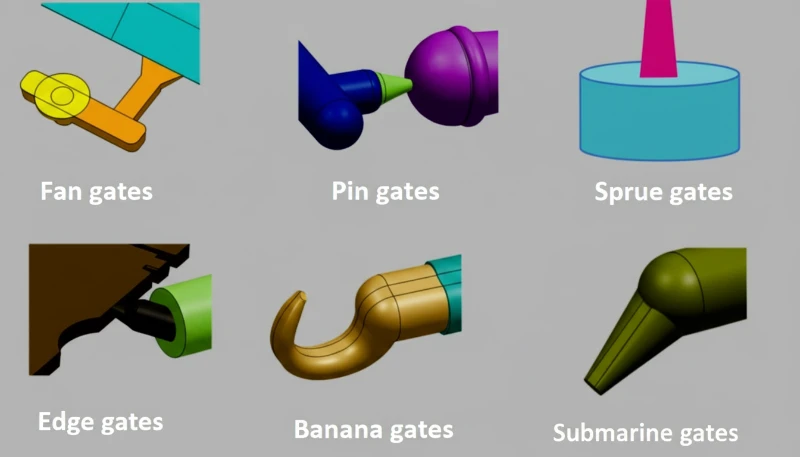
Der Formenbau hat einen erheblichen Einfluss auf den CO2-Fußabdruck pro Teil. Heißkanalsysteme eliminieren Kaltkanalabfall. Konforme Kühlkanäle reduzieren die Zykluszeiten um 20–40%. Optimierte Angussstellen reduzieren den Druckbedarf, was geringere Maschinentonnagen und Energieverbrauch ermöglicht.
Conclusion: Practical Steps Toward Lower-Carbon Injection Molding
Die Reduzierung des CO2-Fußabdrucks beim Spritzgießen ist kein Einzelprojekt – es ist eine kontinuierliche Verbesserungsdisziplin, die Maschinenauswahl, Prozessparameter, Materialwahl und Fabrikinfrastruktur umfasst. Beginnen Sie mit der Messung: unterführen Sie Ihre Maschinen, verfolgen Sie den spezifischen Energieverbrauch und berechnen Sie Ihre CO2-Basislinie pro Teil. Greifen Sie dann zuerst die größten Hebel an – Maschinenupgrades, Zykluszeitoptimierung und die Einführung von Recyclingmaterial.
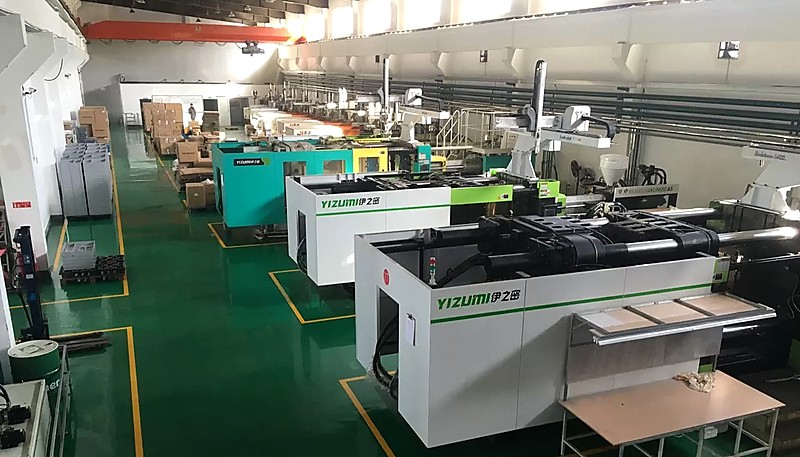
Bei ZetarMold betreiben wir in unserer Einrichtung in Shanghai 47 Spritzgießmaschinen im Bereich von 90T bis 1850T, unterstützt durch die Umweltmanagementsysteme ISO 14001 und ISO 45001. Unser Ingenieursteam optimiert kontinuierlich die Zyklusparameter und bewertet Optionen für Recyclingmaterial, um unsere Umweltauswirkungen zu verringern und gleichzeitig die Qualitätsstandards zu halten, die unsere globalen Kunden erwarten. Wenn Sie einen Fertigungspartner suchen, der die CO2-Reduzierung ernst nimmt, kontaktieren Sie unser Team, um Ihre Projektanforderungen zu besprechen.
-
Carbon Footprint: bezieht sich auf die Gesamtmenge der Treibhausgase, die direkt und indirekt durch eine Aktivität erzeugt werden, ausgedrückt in äquivalenten Tonnen CO2. ↩
-
Life Cycle Assessment: bezieht sich auf eine Methodik zur Bewertung der Umweltauswirkungen eines Produkts von der Rohmaterialgewinnung bis zur Entsorgung, gemäß den ISO-14040/14044-Rahmenwerken. ↩
-
Scope 1 Emissions: bezieht sich auf direkte Treibhausgasemissionen aus Quellen, die einer Organisation gehören oder von ihr kontrolliert werden, wie z.B. die Verbrennung von Brennstoffen vor Ort in Kesseln oder Fahrzeugen. ↩