コンテンツへスキップ
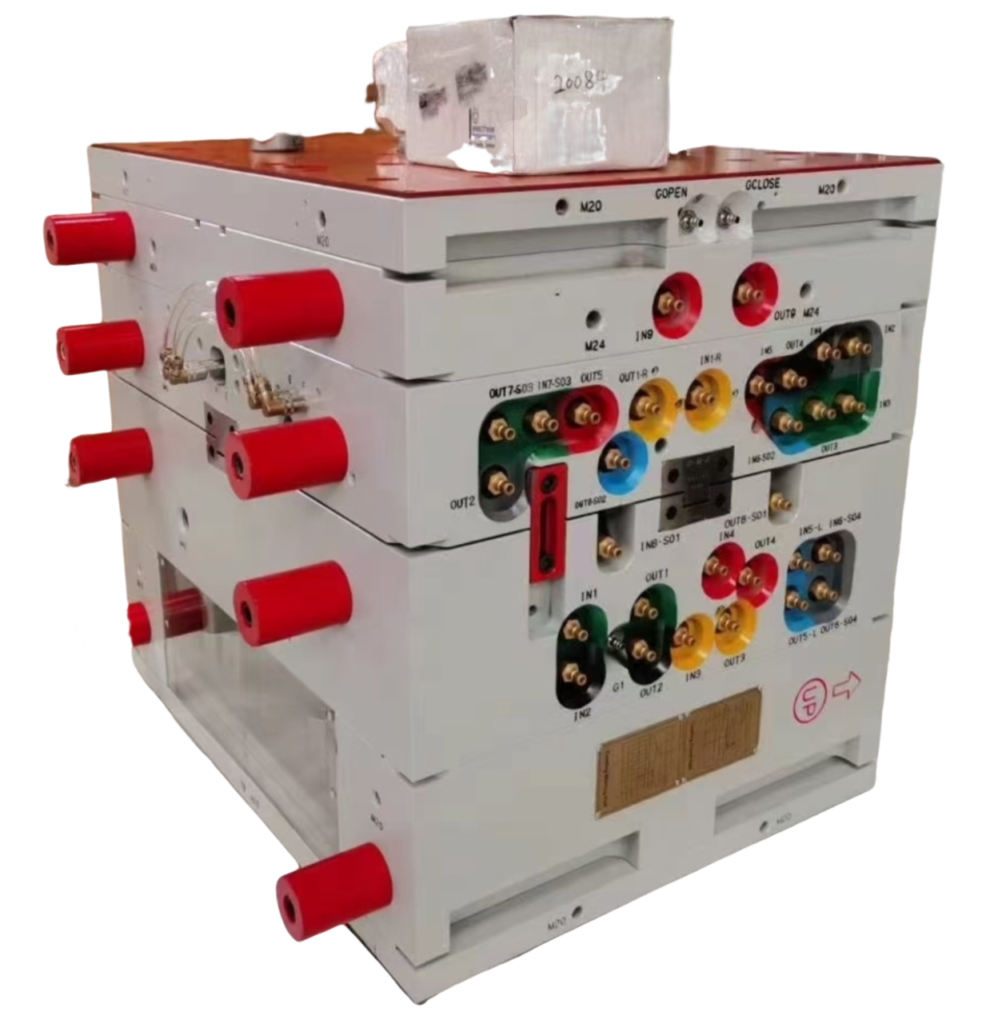
せん断応力とせん断速度の関係を、二つのパラメータ――一貫性指数kと流動挙動指数n――で記述する。ほとんどの熱可塑性プラスチックにおいて、nは1未満であり、これはせん断稀化挙動を意味する。典型的なPPでは、加工温度においてnはおよそ0.3から0.4である。ゲート付近の高せん断速度における粘度低下を考慮するため、べき乗則モデルは実際の成形条件下でのQをより正確に推定する。³ 射出成形正しく設定すると寸法精度の高い部品と滑らかな表面を得られます;誤るとショートショット、シンクマーク、フラッシュ、または焼け材料が発生します。90Tから1850Tプレスを運転する47機の工場では、充填時間の0.3秒超過でも1シフトで数千の不良部品が発生します。
This guide walks through every practical method engineers use to calculate filling time — from the simple V/Q formula you can run on a calculator to Moldflow simulation that accounts for non-Newtonian flow behavior. Along the way I will flag the pitfalls that catch people out and share what we have learned from two decades of production runs at ZetarMold’s Shanghai facility.
- Filling time = cavity volume divided by volumetric flow rate (tf = V/Q).
- Material viscosity, mold geometry, and machine settings all influence fill time.
- Simulation tools (Moldflow, Moldex3D) give plus or minus 5% accuracy for complex molds.
- Optimizing fill time reduces cycle time, cuts scrap, and improves part quality.
- Real-world validation is always the final step — no formula replaces a trial shot.
What Is Injection Molding Machine Filling Time?
射出成形機の充填時間とは、スクリューの移動からキャビティが完全に充填されるまでの充填フェーズの時間です。保圧・保持時間は含まれないため、エンジニアはこれを用いて最初の速度プロファイルを設定し、せん断熱を推定し、機械能力と金型容積を比較します。
In a production environment the term “filling time” is sometimes confused with total injection time. They are not the same. Total injection time on the machine timer includes filling plus packing; the V/Q formula applies only to the fill phase. Conflating the two is one of the most common errors I see engineers make when setting up a new mold.
について 射出成形金型 geometry — runner layout, gate type, wall thickness distribution — dictates how the melt front advances. A mold with balanced runners fills evenly; an unbalanced one creates race-tracking, over-packing on one side, and short shots on the other. That is why mold design and fill-time calculation are inseparable.
Why Does Filling Time Matter for Product Quality?
充填時間は重要です。それは溶融温度、圧力伝達、溶接線、ショートショット、フラッシュ、およびサイクル時間を制御します。充填が遅すぎるとキャビティが満たされる前に流動前端が凍結し、充填が速すぎると材料を過剪断したり、パーティングラインでフラッシュを発生させます。
Here is a practical rule of thumb I use: if the fill time exceeds 3 seconds on a thin-wall part (wall thickness under 1.5 mm), the probability of a short shot rises above 15 percent. If the fill time is under 0.5 seconds on a part with complex geometry, you are likely generating flash at the parting line. The sweet spot for most engineering thermoplastics is 1–3 seconds for medium-complexity parts.
部品品質に加えて、充填時間は直接的にサイクルタイムと生産量に影響します。24時間稼働する16キャビティ金型で、12秒のサイクルから0.5秒を削減すると、1台の機械あたり年間で約25万個の追加生産に相当します。47台のプレスを稼働させる工場では、年間1100万個以上の追加生産となり、収益とコスト面で大きな優位性となります。
“Filling time and packing time are separate phases in the injection cycle.”真
Correct. Filling time covers only the phase when the cavity goes from empty to volumetrically full. Packing time is the subsequent phase where additional material is pushed in to compensate for shrinkage. Most machine timers show injection time as the sum of both.
“A longer filling time always produces better surface finish.”偽
Excessively long fill time allows the melt to cool and increase in viscosity, which can cause flow marks, weld lines, and short shots. Optimal surface finish comes from the right fill speed — not the slowest one.
What Factors Affect Filling Time?
充填時間に影響する主な要因は材料粘度、金型形状、射出速度、圧力限界、および溶融および金型温度です。材料流動挙動が基準を設定し、ランナー長さ、ゲートサイズ、肉厚、および機械流量容量は、流動前端が凍結前にキャビティが充填できるかどうかを決定します。
Material Viscosity
Viscosity is the single biggest material factor. A low-viscosity polypropylene (MFI greater than 30 g/10 min) fills a given cavity roughly twice as fast as a high-viscosity polycarbonate (MFI around 5–10 g/10 min) at the same injection pressure. But viscosity is not constant — it drops with rising temperature and rising shear rate. This shear-thinning1 この挙動は、正確な予測のために非ニュートンモデリングが不可欠である理由です。
金型形状
Runner length and diameter, gate size, number of cavities, and wall-thickness distribution all create flow resistance. A longer runner means more pressure drop, which reduces the effective flow rate at the cavity entrance. Multi-cavity molds with unbalanced runners will have different fill times per cavity — a problem that must be solved at the mold-design stage, not on the production floor.
Machine Parameters
射出速度、射出圧力限界、スクリュー直径、およびノズルチップ形状は、機械が供給できる最大体積流量Qを決定します。40 mmスクリューを150 mm/sで運転する200Tプレスでは、Qはおよそπ×20²×150で、約188.5 cm/sです。そのスクリューを30 mm版に交換すると、Qは約106 cm/sに低下し — 同じキャビティに対して充填時間が約78%増加します。
Melt and Mold Temperature
Higher melt temperature reduces viscosity, speeding up the fill. Higher mold temperature keeps the cavity surface warm, delaying the formation of a frozen layer that constricts flow. Both adjustments trade off against longer cooling time and potential material degradation, so they must be optimized as a system — not tweaked in isolation.
How Do You Calculate Filling Time?
There are four main methods, each trading simplicity for accuracy. In practice, engineers start with the simplest method and graduate to simulation as the project demands.
Method 1 — Empirical Formula (tf = V / Q)
最も広く使用される迅速推定は体積比です。キャビティ体積V(cm)を機械の体積流量Q(cm/s)で割ると、秒単位の充填時間が得られます。流量はスクリュー断面積Aとスクリュー射出速度vから計算されます。式では:Q = A×v = π×(D/2)²×v。そしてtf = V/Q。
実例 — PPハウジング、30 mmスクリュー、100 mm/s、キャビティ体積200 cm。スクリュー面積Aはπ×15²で、706.86 mm²です。流量Qは706.86 mm²×100 mm/sで、70,686 mm/sまたは約70.69 cm/sです。キャビティ体積200 cmを70.69 cm/sで割ると、充填時間は約2.83秒です。
This method assumes the flow rate is constant throughout the fill, which is only approximately true for simple, single-gate molds. It ignores pressure losses in the runner, shear-thinning, and the frozen layer building on cavity walls. Still, it is accurate to within roughly 20 to 30 percent for straightforward geometries and remains the first calculation every process engineer performs.
Method 2 — Newtonian Fluid Model
For Newtonian fluids, viscosity is constant regardless of shear rate. Under this assumption, you can use the Hagen-Poiseuille equation2 既知の寸法のチャネルを通る流れに対して、各ランナーセグメントの圧力損失を計算し、利用可能な射出圧力からQを導出します。実際には、成形充填時に真のニュートン流体として挙動する熱可塑性プラスチックはほとんどありません — ほとんどは擬塑性材料で剪断薄化します。ニュートンモデルは主に教育ツールとして、およびシミュレーション出力の妥当性チェックとして有用です。
Method 3 — Non-Newtonian (Power-Law) Model
について power-law model3 せん断応力とせん断速度の関係を、一貫性指数kと流動挙動指数nの2つのパラメータで記述します。ほとんどの熱可塑性プラスチックでは、nは1未満であり、これはせん断稀薄化挙動を意味します。典型的なPPでは、加工温度においてnはおよそ0.3から0.4です。パワーローモデルは、ゲート付近の高せん断速度における粘度低下を考慮するため、実際の成形条件下でのQをより正確に推定します。
射出ユニットを強調した機械の概略図。
“Most thermoplastics are shear-thinning, meaning viscosity decreases as shear rate increases.”真
Correct. Under the power-law model, most thermoplastics have a flow behavior index n less than 1, so effective viscosity drops at higher shear rates. This is why injection speed has a non-linear effect on fill time and why faster injection can fill cavities more efficiently than a simple linear model would predict.
“The empirical V/Q formula accounts for pressure loss in the runner system.”偽
The simple tf equals V divided by Q formula assumes constant flow rate and ignores runner pressure drop, shear-thinning, and frozen layer build-up. It is a first approximation only.
Method 4 — Numerical Simulation (Moldflow or Moldex3D)
Modern CAE tools solve the full momentum, energy, and continuity equations on a 3D mesh of the mold geometry, using the material’s actual rheological data (often supplied by the resin manufacturer). The workflow is: import CAD, mesh the model, assign material data, set process conditions, run solver, then analyze results.
Simulation accuracy for filling time is typically within 3 to 8 percent compared to measured values — a dramatic improvement over the 20 to 30 percent margin of the empirical formula. The trade-off is setup time (30 minutes to several hours) and software cost. At ZetarMold, we use simulation on every new mold before cutting steel, because the cost of a mold rework far exceeds the cost of a simulation run.
For the PP housing example above, Moldflow predicted a fill time of 2.85 seconds — within 0.7 percent of the measured 2.83 seconds. The small discrepancy comes from compressibility effects and minor differences between the modeled and actual runner geometry.
“Profiled injection speed can reduce fill time while also lowering defect rates.”真
By starting slow through the gate (preventing jetting), speeding up in the cavity, and decelerating near end-of-fill (allowing air evacuation), profiled injection achieves the best of both worlds — shorter fill and fewer defects. Most modern machines support 5 to 10 velocity stages.
“Adding a second gate always improves part quality.”偽
A second gate reduces fill time but introduces a weld line where the two melt fronts meet. If the weld line falls on a structural or cosmetic surface, the part may be weaker or visually defective. Gate placement must be optimized holistically using simulation to predict weld-line location.
How Do All Calculation Methods Compare?
計算方法は経験的なV/Q、ニュートン流動、パワー法則流動、および数値シミュレーションです。単純なV/Q法は初期推定に十分な速度ですが、MoldflowやMoldex3Dは薄肉、多ゲート、または高リスク生産金型に対して最良の予測を与えます。
| Method | Calculated Fill Time | Accuracy vs. Measured | Setup Effort |
|---|---|---|---|
| Empirical (V/Q) | 2.83 s | baseline | 1 minute |
| Newtonian model | 2.83 s | same assumptions | 10 minutes |
| Power-law model | 2.78 s | approximately minus 1.8% | 30 minutes |
| Moldflow simulation | 2.85 s | plus 0.7% | 1 to 2 hours |
| Measured (trial shot) | 2.80 s | actual | 2 to 4 hours |
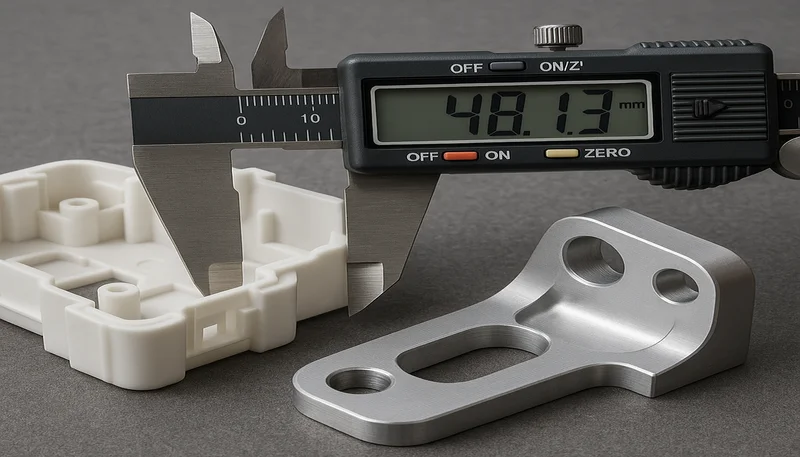
この比較的単純な単一ゲート部品では、すべての方法が2%以内で一致します。違いは多ゲート、薄肉、またはインサート成形部品で非常に大きくなります — まさにシミュレーションが効果を発揮する状況です。厳しい公差部品(±0.05 mmを保持するCNC加工金型)では、0.2秒の充填時間誤差でも寸法が仕様外になる可能性があり、そのためほとんどの高精度成形業者は本生産前にショートショット研究に対して計算を検証します。
How Can You Optimize Filling Time?
Calculating fill time is only the beginning. Optimizing it — reducing cycle time while maintaining or improving part quality — is where the real engineering value lies. Here are the levers we pull most often on the production floor.
Increase Injection Speed
Raising the screw velocity from 100 mm/s to 150 mm/s in our example drops fill time from 2.83 s to about 1.89 s. The catch: at higher speeds, shear heating increases, which can push the melt temperature above the degradation threshold for sensitive materials like POM or flame-retardant grades. Always monitor melt temperature with a pyrometer after speed changes.
Optimize Runner and Gate Design
Adding a second gate to our example mold reduced simulated fill time from 2.85 s to 1.75 s — a 39 percent improvement. Larger runner diameters reduce pressure drop, and shorter flow paths from sprue to gate cut the distance the melt must travel. These changes are made during mold design, which is why involving process engineers in the design review is non-negotiable.
Raise Melt Temperature Within Limits
Increasing melt temperature from 220 degrees C to 240 degrees C for PP can reduce viscosity by 20 to 30 percent, shortening fill time proportionally. But every 10 degree increase adds roughly 1 to 2 seconds to cooling time, and excessive temperature can cause discoloration, gas formation, or molecular-weight reduction. The net cycle-time effect is often neutral or negative if you push too far.
Use Profiled Injection Speed
Rather than running at a single speed, modern machines allow multi-stage velocity profiles — slow through the gate to prevent jetting, then fast through the cavity, then slow again near the end of fill to prevent flash and allow air to escape. Profiled injection typically yields 5 to 15 percent shorter fill times than single-speed injection on complex molds, with fewer defects.
What Does Real-World Production Teach Us About Filling Time?
実際の生産では、充填時間は推定値であり、ショートショット研究、キャビティバランスチェック、および部品検査で検証する必要があります。上海の施設では、V/Q推定値から始め、充填パターンを確認し、その後、欠陥、サイクル時間、および寸法安定性に対して速度プロファイルを調整します。
実際の生産では、充填時間はショートショット研究、キャビティバランスチェック、および部品検査によって検証される推定値であることが示されています。上海の施設では、初期射出速度を設定するためにV/Q推定値から始め、その後、欠陥、サイクル時間、および寸法安定性に対して速度プロファイルを調整する前にショートショット研究を実行します。
One lesson that took years to internalize: the fastest fill time is rarely the best fill time. On a multi-cavity mold for automotive connectors, we found that running at 85 percent of maximum injection speed actually yielded lower scrap than running flat-out, because the slightly slower fill gave the vents enough time to evacuate air. The 0.3 seconds we added to fill time saved 12 percent in scrap — a far larger cost saving than the tiny throughput reduction.
射出成形部品を調達している場合、機械速度を上げるだけではなく科学的に充填時間を最適化するサプライヤーを望むなら、製造パートナーを評価するためのフレームワークとして、射出成形サプライヤー調達ガイドをご覧ください。

Frequently Asked Questions About Filling Time
射出成形機の充填時間:エキスパートガイド
Most medium-complexity thermoplastic parts fill in 1 to 3 seconds under standard processing conditions on typical production equipment. Thin-wall packaging molds may fill in under 0.5 seconds, while large structural parts with thick walls can take 5 to 10 seconds to fill completely. The exact range depends on cavity volume, material viscosity, wall thickness, and the injection molding machine maximum flow rate capability. Always benchmark against similar molds in your own production history to establish a realistic baseline before fine-tuning process parameters for a new mold project.
How do you measure actual filling time on a machine?
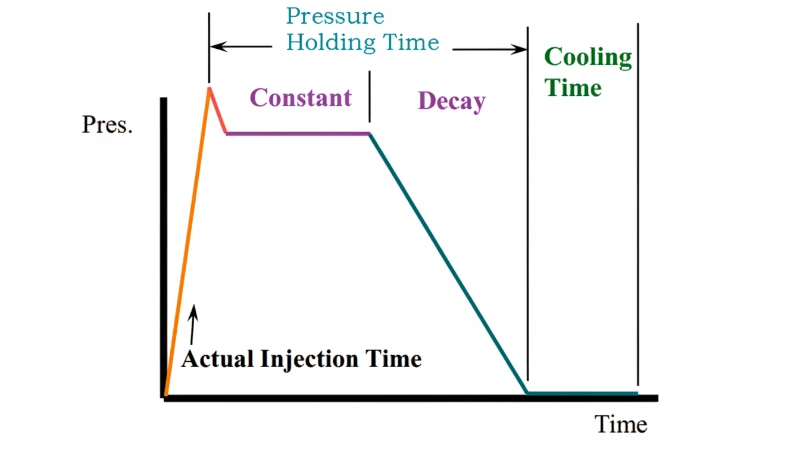
Most modern injection molding machines display fill time directly on the controller screen, making it easy to read during initial setup and subsequent process optimization runs. You can also observe the transition from injection pressure to holding pressure on the pressure-versus-time graph, where the inflection point clearly marks the end of the fill phase. For older machines without digital readouts, a stopwatch from screw start to the pressure switchover click gives a reasonable approximation of the actual fill duration in seconds.
Does filling time change with different plastics?
Yes, filling time changes significantly with different plastics due to their varying melt viscosities and thermal properties during the molding process. Low-viscosity materials like polypropylene with an MFI above 20 fill faster than high-viscosity materials like polycarbonate or PEEK, even at the same injection pressure setting on the machine. The material shear-thinning behavior also plays an important role in practice — some polymers thin dramatically under high shear rates, which effectively speeds up cavity filling compared to what a constant-viscosity calculation would predict.
Can filling time be too short?
Absolutely, filling time can definitely be too short for the specific part and mold design at hand. Extremely fast fills cause excessive shear heating, air traps, jetting through the gate, and flash at the parting line of the mold. On transparent parts, jetting creates visible worm-like cosmetic defects on the surface; on structural parts, trapped air causes internal burns and mechanically weak spots. The optimal fill time balances speed with part quality and dimensional consistency — it is not always the minimum possible time your machine can achieve.
What happens if filling time is too long?
When filling time is too long, the melt cools progressively and thickens as it flows through the cavity, increasing the risk of short shots, surface flow marks, and high residual stress in the finished part. Thin-wall parts are especially sensitive to this particular problem — if the frozen layer closes off the flow channel before the cavity is completely full, you get an incomplete part. Long fill times also reduce overall production throughput by extending the injection phase of the molding cycle unnecessarily.
Is Moldflow simulation worth the cost for small molds?
For simple single-cavity molds with straightforward geometry, the basic V/Q formula is usually sufficient for initial setup and saves the simulation fee entirely. For multi-cavity, thin-wall, or high-precision molds, simulation pays for itself by preventing even a single mold revision, which typically costs 10 to 50 times the combined simulation software and engineering time fee. As a practical guideline, any mold with more than two cavities or a flow-length-to-thickness ratio above 100 should definitely be simulated before the mold tool is cut.
How does wall thickness affect filling time?
Thinner walls restrict polymer flow and increase viscous resistance in the mold cavity, requiring higher injection pressure and often resulting in longer overall fill times for the part. The flow length-to-thickness ratio is a key metric for judging fillability of a design — ratios above 150 typically require very high injection speeds to fill completely without short shots. Product designers should aim for uniform wall thickness throughout the part geometry to avoid flow hesitations that cause air traps, weld-line visibility issues, and uneven fill patterns.
What is the difference between fill time and cycle time?
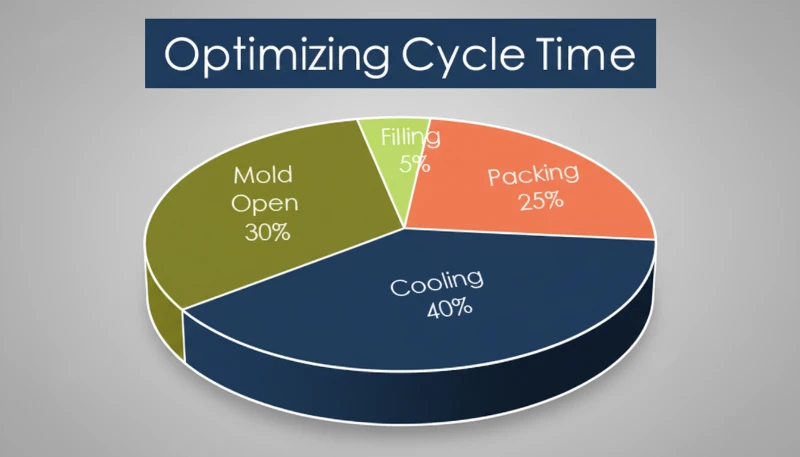
Fill time is just the cavity-filling phase, typically lasting 1 to 3 seconds depending on part size, material choice, and mold complexity. Cycle time includes the complete sequence of filling, packing, cooling, mold opening, ejection, and mold closing — usually 10 to 60 seconds total for a complete production molding cycle. Fill time is typically only 5 to 15 percent of the total cycle. Reducing fill time alone may not significantly reduce overall cycle time if cooling is the dominant bottleneck in the process.
結論
Filling time sits at the intersection of material science, mold engineering, and machine capability. The simplest calculation — tf equals V divided by Q — gives you a useful starting point. Adding rheological modeling or full simulation progressively improves accuracy. And real-world trial shots remain the ultimate validation.
Optimizing fill time is not about chasing the fastest possible number. It is about finding the speed that delivers dimensionally stable, cosmetically clean parts at the lowest total cost — accounting for cycle time, scrap rate, and tooling longevity. That balance is exactly what our engineering team at ZetarMold works toward on every project.
Need help optimizing your injection molding process? ZetarMoldのエンジニアリングチームは、DFMフィードバック、金型流動シミュレーション、生産プロセス最適化を提供します。400種類以上の材料と47台の機械(90T~1850T)での20年以上の経験を活かし、充填時間をはじめとするあらゆるパラメータを正確に調整するお手伝いをします。今すぐ無料見積もりをご依頼ください。
-
shear-thinning: Shear-thinning refers to the phenomenon where a fluid’s viscosity decreases as the applied shear rate increases. Most thermoplastic melts exhibit this behavior during injection molding. ↩
-
Hagen-Poiseuille equation: The Hagen-Poiseuille equation describes laminar flow of a Newtonian fluid through a long cylindrical pipe, relating flow rate to pressure drop, pipe radius, and fluid viscosity. ↩
-
power-law model: power-law fluid model refers to the power-law or Ostwald-de Waele model relates shear stress to shear rate with the equation τ = k × γ̇ⁿ, where k is the consistency index and n is the flow behavior index. ↩



 EN
EN  ES
ES  FR
FR  DE
DE  PT
PT  AR
AR  RU
RU  JA
JA  KO
KO  IT
IT  NL
NL  TR
TR  PL
PL