
- Injection molding shrinkage typically ranges from 0.1% to 3.0%, depending on material type and processing conditions.
- Semi-crystalline polymers like PP and Nylon shrink 1.0% to 3.0%, while amorphous resins like ABS and PC shrink 0.3% to 0.8%.
- Non-uniform shrinkage causes warpage, sink marks, and dimensional inaccuracy in finished parts.
- Packing pressure, melt temperature, cooling rate, and wall thickness are the four primary controllable shrinkage factors.
- Mold flow simulation software can predict shrinkage within 0.05% accuracy when material data and process parameters are properly calibrated.
What Is Injection Molding Shrinkage?
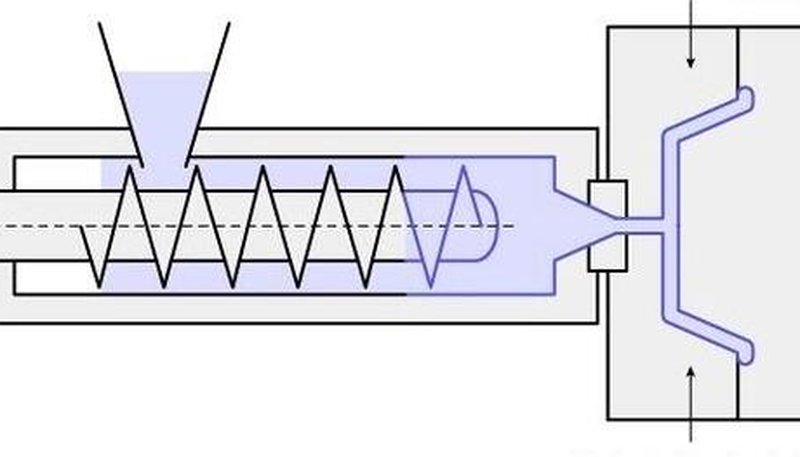
Injection molding shrinkage is the volumetric reduction that occurs when molten polymer cools and solidifies inside a mold cavity, typically ranging from 0.1% to 3.0% of the original part dimensions. Every thermoplastic material contracts as it transitions from a molten state (150–400°C) to room temperature (23°C), and this contraction must be compensated for in the mold cavity dimensions.
The shrinkage percentage is calculated using a straightforward formula: Shrinkage (%) = [(Mold Dimension − Part Dimension) / Mold Dimension] × 100. For example, a mold cavity measuring 100.00 mm that produces a part measuring 99.40 mm has a shrinkage rate of 0.60%. Mold designers scale cavity dimensions larger by the expected shrinkage factor to hit target part dimensions.
Shrinkage is not a defect by itself. It is an inherent physical property of thermoplasten1 during the cooling phase. The problem arises when shrinkage is non-uniform across different regions of a part, which leads to warpage, sink marks, and dimensional failures. Understanding and predicting shrinkage is the foundation of producing dimensionally accurate injection molded parts.
Two distinct shrinkage phases occur during the molding cycle. In-mold shrinkage happens while the part is still constrained by the cavity walls, typically accounting for 30–50% of total shrinkage. Post-mold shrinkage continues after ejection as the part reaches thermal equilibrium with the ambient environment over 24–48 hours.
Both phases must be accounted for in mold design and quality inspection timing. Parts measured immediately after ejection will show different dimensions than parts measured 48 hours later. For precision applications, ASTM D955 specifies conditioning parts at 23°C and 50% relative humidity for a minimum of 40 hours before taking final dimensional measurements.
The magnitude of shrinkage also varies by direction within the same part. In-flow shrinkage (parallel to the melt flow path) and cross-flow shrinkage (perpendicular to flow) often differ by 10–30% even in unfilled materials. This directional behavior becomes more pronounced with fiber-reinforced compounds, where flow-direction shrinkage can be one-third of the cross-flow value.
“Injection molding shrinkage occurs in two phases: in-mold shrinkage during cooling and post-mold shrinkage after ejection.”Echt
In-mold shrinkage accounts for 30–50% of total contraction while the part is constrained by cavity walls. Post-mold shrinkage continues for 24–48 hours after ejection as the part reaches full thermal equilibrium at room temperature.
“All plastics shrink at the same rate during injection molding.”Vals
Shrinkage rates vary dramatically by material type. Semi-crystalline polymers like polypropylene shrink 1.0–2.5% due to crystal formation, while amorphous polymers like polycarbonate shrink only 0.5–0.7% because they lack an organized molecular structure during solidification.
What Causes Injection Molding Shrinkage?
Injection molding shrinkage is driven by four primary factors: material crystallinity, processing temperature, packing pressure, and part geometry, with material type alone accounting for up to 70% of the total shrinkage variation. Understanding the relative contribution of each factor allows engineers to make targeted adjustments rather than trial-and-error process tweaking.
Material Crystallinity and Molecular Structure
Semi-crystalline polymers (PP, PE, Nylon, POM) form tightly packed crystalline regions during cooling. These organized molecular structures occupy less volume than the random arrangement in the melt, producing shrinkage rates of 1.0–3.0%. The degree of crystallinity depends on the cooling rate. Slow cooling allows more crystal formation and higher shrinkage.
Amorphous polymers (ABS, PC, PS, PMMA) solidify with randomly oriented molecular chains. Without crystal formation, their shrinkage is primarily thermal contraction, producing rates of 0.3–0.8%. Glass fiber reinforcement reduces shrinkage in both types by restricting molecular movement. A 30% glass-filled Nylon shrinks 0.3–0.5% compared to 1.2–1.8% for unfilled Nylon.

Processing Temperature Effects
Higher melt temperatures increase the temperature differential between injection and solidification, leading to greater thermal contraction. For polypropylene, increasing melt temperature from 200°C to 260°C raises shrinkage from 1.2% to 1.8%. Mold temperature has the opposite interaction: higher mold temperatures slow cooling, increase crystallinity in semi-crystalline materials, and produce more uniform but slightly higher overall shrinkage.
The optimal balance for most semi-crystalline parts is a moderate melt temperature (middle of the recommended range) combined with a mold temperature that promotes uniform crystallization. For amorphous materials, mold temperature primarily affects residual stress and surface quality rather than total shrinkage magnitude.
Packing Pressure and Hold Time
Packing pressure forces additional material into the cavity to compensate for volumetric contraction during cooling. Insufficient packing pressure is the most common process-related cause of excessive shrinkage. Increasing packing pressure from 40 MPa to 80 MPa typically reduces shrinkage by 0.2–0.5% for semi-crystalline materials. However, excessive packing creates residual stress and can cause sticking or ejection damage.
Hold time must be long enough for the gate to freeze. If the gate solidifies before the part interior, no additional packing material can enter the cavity, and the core material contracts freely. Gate freeze time depends on gate thickness, material thermal properties, and mold temperature. Typical hold times range from 3 to 15 seconds.
Shrinkage Rates by Material Type
Material selection determines 60–70% of the expected shrinkage range, making it the single most important factor in dimensional planning. Semi-crystalline materials consistently show 2–5 times higher shrinkage than amorphous materials due to the volume reduction during crystal packing. The following table provides industry-standard shrinkage ranges based on ASTM D955 test methods.
| Materiaal | Type | Shrinkage Range (%) | Typical Value (%) |
|---|---|---|---|
| PP (polypropyleen) | Semi-crystalline | 1.0–2.5 | 1.5 |
| PE (polyethyleen) | Semi-crystalline | 1.5–3.0 | 2.0 |
| Nylon (PA6) | Semi-crystalline | 0.8–1.5 | 1.2 |
| Nylon (PA66) | Semi-crystalline | 1.0–2.2 | 1.5 |
| POM (Acetal) | Semi-crystalline | 1.8–2.5 | 2.0 |
| ABS | Heeft het nodig | 0.4–0.7 | 0.5 |
| PC (polycarbonaat) | Heeft het nodig | 0.5–0.7 | 0.6 |
| PS (polystyreen) | Heeft het nodig | 0.3–0.6 | 0.4 |
| PMMA (Acrylic) | Heeft het nodig | 0.2–0.8 | 0.5 |
| PBT (30% GF) | Semi-crystalline | 0.3–0.5 | 0.4 |
| Nylon (30% GF) | Semi-crystalline | 0.3–0.5 | 0.4 |
Glass fiber reinforcement dramatically reduces shrinkage by restricting polymer chain mobility during cooling. A 30% glass-filled compound typically cuts shrinkage by 50–70% compared to the unfilled grade. However, glass fibers create anisotropic shrinkage: the part shrinks less in the flow direction (where fibers align) and more in the cross-flow direction. This directional difference often requires separate shrinkage factors for each axis in the mold design.
Fillers such as talc, calcium carbonate, and mineral reinforcements also reduce shrinkage, though less effectively than glass fibers. A 20% talc-filled PP shrinks approximately 0.8–1.2% compared to 1.5–2.5% for unfilled PP. The choice between fillers depends on the balance of shrinkage reduction, mechanical properties, and surface finish requirements.
How to Predict Injection Molding Shrinkage
Modern analyse van de matrijsstroming2 software predicts shrinkage within ±0.05% accuracy when calibrated with measured material data and validated process conditions. Simulation tools model the complete thermomechanical behavior: filling, packing, cooling, and the resulting volumetric contraction across every element of the part geometry.

The simulation workflow starts with a 3D mesh of the part and runner system, followed by material property input (PVT data, viscosity curves, thermal conductivity), boundary conditions (melt temperature, mold temperature, injection speed profile), and packing parameters. The solver calculates local shrinkage at every mesh element, producing color-mapped results that identify high-shrinkage zones before any steel is cut.
Simulation results guide mold designers on where to add packing, adjust gate locations, or modify wall thickness. For example, if simulation shows 2.1% shrinkage near a thick boss and 0.8% shrinkage at the gate, the designer can enlarge the gate cross-section, add a secondary gate, or reduce the boss wall thickness to equalize shrinkage across the part.
Without simulation, shrinkage prediction relies on material data sheet values and empirical rules of thumb. This approach works adequately for simple geometries with uniform wall thickness but consistently fails for complex parts with varying wall sections, ribs, bosses, and multiple gates. The cost of a single mold iteration ($5,000–$50,000) almost always justifies the investment in upfront simulation ($500–$2,000 per analysis).
“Mold flow simulation can predict shrinkage within ±0.05% when properly calibrated with measured PVT data.”Echt
Modern simulation packages like Moldflow and Moldex3D use pressure-volume-temperature (PVT) material characterization to model the thermodynamic state of the polymer at every point during filling, packing, and cooling. Calibrated models routinely achieve ±0.05% accuracy against measured parts.
“Material data sheet shrinkage values are sufficient for predicting shrinkage in complex parts.”Vals
Data sheet values represent shrinkage measured under standardized test conditions (ASTM D955) on simple test bars. Real parts have varying wall thickness, multiple gates, ribs, and bosses that create local shrinkage variations not captured by a single published number. Complex parts require simulation or empirical testing with the actual mold.
Non-Uniform Shrinkage and Common Defects
Non-uniform shrinkage is the root cause of 80% of dimensional failures in injection molded parts, producing warpage, sink marks, voids, and out-of-tolerance features. When different regions of a part shrink at different rates, internal stresses develop that distort the final geometry. A flat panel with 0.3% differential shrinkage across its width will bow or twist visibly.
Three primary mechanisms create non-uniform shrinkage: varying wall thickness across the part geometry, unequal cooling rates between the core and cavity sides of the mold, and pressure gradients from the gate to the end of fill. Each mechanism produces a distinct defect pattern. Wall thickness variations cause localized sink marks. Cooling imbalance causes bowing or twisting. Pressure gradients cause end-of-fill short packing and dimensional taper from gate to far end.

Sink Marks and Internal Voids
Sink marks appear as surface depressions above thick sections, ribs, or bosses where the core material cools last and contracts inward. The standard rule is that rib thickness should not exceed 60% of the adjacent wall thickness to minimize visible sink marks. When the rib-to-wall ratio exceeds 80%, sink marks become visible even with optimized packing pressure.
Internal voids form when the outer shell solidifies first, and the molten core contracts with no material to fill the gap. Voids are particularly problematic in structural parts where they reduce load-bearing cross-sections. Increasing packing pressure and hold time, reducing melt temperature, and using gas-assist or foam injection techniques are common remedies. X-ray or CT scanning is often required to detect internal voids that are invisible from the surface.
Warpage from Differential Shrinkage
Warpage occurs when the core side and cavity side of a part shrink at different rates, typically caused by unequal cooling rates. If the cavity surface cools to 40°C while the core surface remains at 70°C, the core side shrinks more after ejection, pulling the part into a concave shape toward the core. Temperature differentials of 10°C or more between mold halves produce measurable warpage in most thin-wall parts.
Glass-fiber-filled materials create additional warpage complexity due to anisotropic shrinkage. Fibers orient in the flow direction during filling, restricting shrinkage along the flow path but allowing normal shrinkage perpendicular to flow. A 30% glass-filled Nylon may shrink 0.3% in the flow direction but 1.0% in the cross-flow direction, producing predictable but difficult-to-compensate bowing.
Mold Design Strategies to Control Shrinkage
Juist ontwerp van spuitgietmatrijzen3 accounts for shrinkage well before the first shot is fired, using scaled cavity dimensions, strategic gate placement, and optimized cooling channel layouts to produce parts within tolerance from the initial trial run. The mold designer applies material-specific shrinkage factors to every cavity dimension during the CAD design phase.

Cavity Scaling and Shrinkage Factors
Mold cavities are machined larger than the target part dimensions by the expected shrinkage percentage. For a part with 1.5% expected shrinkage, a 50.00 mm target dimension requires a cavity dimension of 50.75 mm. Complex parts may use different shrinkage factors for different axes. For glass-filled materials, flow-direction cavities are scaled by 0.3% while cross-flow dimensions are scaled by 1.0%.
Critical-tolerance features (bearing bores, snap-fit dimensions, sealing surfaces) may use “steel-safe” design philosophy. The initial cavity is cut slightly undersized for the feature, allowing material to be removed if the first shots come out too tight. This is far less expensive than welding and re-machining an oversized cavity.
Gate Location and Runner Design
Gate location directly controls how packing pressure propagates through the part. Regions far from the gate receive less packing and therefore shrink more. Positioning the gate near thick sections ensures that packing pressure compensates for the highest-shrinkage zones. Multiple gates may be needed for large or complex parts to maintain uniform packing throughout.
Runner cross-sections must be large enough to maintain adequate pressure at the gate throughout the packing phase. An undersized runner freezes prematurely, cutting off packing pressure and allowing the part to shrink freely. Hot runner systems maintain constant melt temperature to the gate, providing more consistent packing and more uniform shrinkage than cold runner systems.
Cooling Channel Optimization
Uniform cooling is the single most effective mold design strategy for controlling shrinkage variation. Cooling channels should maintain equal distance from all cavity surfaces and provide sufficient heat extraction to solidify the part evenly. The standard design rule is to place cooling channels 1.5–2.0 times the channel diameter from the cavity surface, with center-to-center spacing of 3–5 times the channel diameter.
Conformal cooling channels, produced by additive manufacturing, follow the contour of complex cavity geometries where conventional straight-drilled channels cannot reach. Conformal cooling reduces cycle time by 20–35% and shrinkage variation by up to 40% compared to conventional cooling, making it especially valuable for parts with deep cores, thin walls, or complex curved surfaces.
Process Parameter Optimization for Shrinkage Control
Process parameter optimization reduces shrinkage variation by 30–50% beyond what mold design alone achieves, focusing on packing pressure profiles, melt temperature, mold temperature, and cooling time as the four critical control variables. A systematic Design of Experiments (DOE) approach identifies the optimal combination faster than one-variable-at-a-time adjustment.

The packing phase has the largest process-side influence on shrinkage. A profiled packing pressure (high initial pressure ramping down to a lower hold pressure) provides better cavity filling than constant pressure. Typical profiles start at 80% of injection pressure and ramp down to 40–60% over the hold time. The transition point should align with gate freeze to avoid wasted energy after the gate solidifies.
Cooling time must be long enough for the entire part cross-section to solidify below the material’s heat deflection temperature (HDT) before ejection. Premature ejection leads to post-mold shrinkage and warpage as the still-warm core continues to contract. The minimum cooling time is proportional to the square of the wall thickness. Doubling wall thickness quadruples the required cooling time.
Scientific molding methodology uses cavity pressure sensors to monitor the actual conditions inside the mold during every cycle. By maintaining consistent peak cavity pressure (±2%) and pressure at gate seal, cycle-to-cycle shrinkage variation drops below 0.05%. This level of process control is essential for medical devices, automotive safety parts, and precision assemblies with tight DFM4 tolerances.
Frequently Asked Questions About Injection Molding Shrinkage?
What is the acceptable shrinkage rate for injection molded parts?
Acceptable shrinkage depends on the material and application tolerance requirements. For general-purpose parts, staying within the published material shrinkage range is acceptable, typically ±0.2% of the nominal value. For precision parts requiring tolerances tighter than ±0.1 mm, shrinkage must be predicted within ±0.05% using mold flow simulation and validated with first-article measurements. Semi-crystalline materials like PP and Nylon have wider acceptable ranges (1.0–2.5%) while amorphous materials like ABS and PC target narrower ranges (0.4–0.7%). The key metric is consistency between cycles, not the absolute shrinkage value.
How does wall thickness affect injection molding shrinkage?
Wall thickness has a direct relationship with shrinkage magnitude and uniformity. Thicker walls cool more slowly, allowing more crystallization in semi-crystalline materials and producing higher local shrinkage. A 4 mm wall section typically shrinks 15–25% more than a 2 mm wall section in the same part. Non-uniform wall thickness is the primary cause of differential shrinkage and warpage. The general design guideline is to maintain wall thickness variation within a 25% range (for example, 2.0 mm to 2.5 mm) throughout the part to minimize differential shrinkage.
Can you reduce injection molding shrinkage to zero?
No, shrinkage cannot be eliminated because it is an inherent physical property of polymer cooling. All thermoplastics contract as they transition from melt temperature to room temperature. The goal is not zero shrinkage but predictable and uniform shrinkage that can be compensated for in the mold design. Amorphous materials with low shrinkage rates (0.2–0.4%) come closest to minimal shrinkage, but even these materials require cavity scaling. Glass fiber reinforcement reduces shrinkage to as low as 0.1–0.3% in heavily filled compounds.
What is the difference between isotropic and anisotropic shrinkage?
Isotropic shrinkage means the material contracts equally in all directions, which is typical of unfilled amorphous polymers like polycarbonate and ABS. Anisotropic shrinkage means the material shrinks at different rates in different directions, which occurs in fiber-reinforced materials and semi-crystalline polymers with oriented molecular chains. A 30% glass-filled Nylon may shrink 0.3% in the flow direction but 1.0% perpendicular to flow. Mold designers must apply separate shrinkage factors for each axis when working with anisotropic materials, significantly increasing design complexity.
How long does post-mold shrinkage continue after ejection?
Post-mold shrinkage occurs primarily during the first 24–48 hours after ejection as the part reaches full thermal and stress equilibrium with the ambient environment. However, measurable dimensional changes can continue for up to 7 days in thick-walled semi-crystalline parts as secondary crystallization progresses. For dimensional inspection purposes, industry practice recommends conditioning parts at 23°C and 50% relative humidity for a minimum of 24 hours before measurement. Critical measurements on semi-crystalline parts should be repeated at 48 and 72 hours to confirm dimensional stability.
How does packing pressure affect shrinkage in injection molding?
Packing pressure is the most effective process-side tool for reducing shrinkage. It forces additional molten material into the cavity during the cooling phase to compensate for volumetric contraction. Increasing packing pressure from 40 MPa to 80 MPa typically reduces shrinkage by 0.2–0.5% in semi-crystalline materials. The packing phase must continue until the gate freezes (solidifies), which typically takes 3–15 seconds depending on gate geometry. After gate freeze, no additional material can enter the cavity regardless of pressure applied. Overpacking causes residual stress, flash, and ejection difficulties.
-
thermoplastics: Thermoplastics are a class of polymers that become pliable above a specific temperature and solidify upon cooling, defined as materials that can be repeatedly melted and reshaped without significant chemical degradation. ↩
-
mold flow analysis: Mold flow analysis is a simulation technique used to predict how molten plastic fills a mold cavity, measured in terms of fill time, pressure distribution, and cooling uniformity. ↩
-
injection mold design: Injection mold design refers to the engineering process of creating the tool geometry, gating system, cooling channels, and ejection mechanisms that shape molten plastic into finished parts. ↩
-
DFM: DFM, or Design for Manufacturability, is an engineering approach that optimizes part geometry and material selection to reduce production cost and defect rates during injection molding. ↩