コンテンツへスキップ
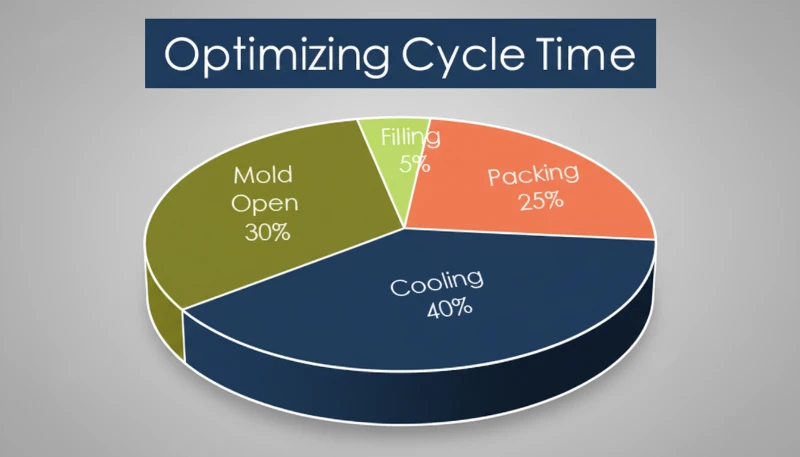
Injection molding is a cyclic process — every part is born from a repeating sequence of injection, packing, cooling, and ejection. The total time for one complete loop is the サイクルタイム1, and it directly controls your production rate and per-part cost. In our Shanghai factory, we have spent over 20 years fine-tuning cycle times across thousands of molds. This guide breaks down the calculation method so you can estimate, measure, and optimize cycle time on your own projects.
- Cycle time = injection + packing + cooling + ejection + mold open/close
- Cooling typically accounts for 60–70% of total cycle time
- Wall thickness is the single biggest driver of cooling duration
- A 1-second reduction can yield 100,000+ extra parts per year on a multi-cavity mold
- Proper mold cooling design is the most cost-effective optimization
What Is Cycle Time in Injection Molding?
Cycle time is the total elapsed time from the start of one injection shot to the start of the next. It measures how fast your machine can produce parts — and it’s the single most important metric for 射出成形金型ing productivity.
Think of it this way: if you’re running a 4-cavity mold with a 30-second cycle, that’s roughly 480 parts per hour. Shrink that to 25 seconds, and you jump to 576 — a 20% production boost with zero additional capital investment. That’s why experienced engineers obsess over every second.
The formula is straightforward in concept: t_cycle = t_inject + t_pack + t_cool + t_open + t_eject + t_close. In practice, some phases overlap. Screw recovery2 (plasticizing the next shot) happens during cooling, so you take the longer of t_cool and t_screw_recovery rather than adding both.
Cycle time isn’t a fixed property — it changes with material, part geometry, mold design, and machine settings. A thin-wall PP cap might cycle in 5–8 seconds, while a thick-wall polycarbonate housing could take 60 seconds or more. Engineers often talk about “optimal cycle time” — the fastest repeatable cycle that still produces parts meeting all quality specs. Push too fast, and you get short shots, sink marks, or dimensional drift. Push too slow, and you’re bleeding money on machine time.
How Do You Calculate Cycle Time Step by Step?
The cycle time formula is the sum of injection, packing, cooling, and mold operation times. Some phases overlap — for example, screw recovery happens during cooling — so you take the longer duration rather than adding both.
Injection Time (t_inject)
This is how long it takes to fill the cavity with molten plastic. For most parts, it’s 0.5–5 seconds. You can estimate it as: t_inject = Part weight (g) ÷ Injection rate (g/s). For example, a 50g part on a machine delivering 100 g/s takes about 0.5 seconds to fill. But real injection profiles use multi-stage speeds (slow-fast-slow), so actual time is slightly longer than the theoretical minimum.
Packing/Holding Time (t_pack)
After the cavity fills, you maintain pressure to compensate for material shrinkage. This typically runs 1–10 seconds depending on wall thickness and gate freeze-off time. Thin parts freeze fast; thick parts need longer hold. The packing phase ends when the gate solidifies, sealing the cavity.
Cooling Time (t_cool)
This is where most of your cycle lives. For semi-crystalline materials, 冷却時間3 is roughly proportional to the square of wall thickness: t_cool ≈ C × (wall thickness)², where C depends on material thermal diffusivity and the temperature difference between melt and mold. For a 3mm wall in ABS, expect 15–25 seconds. For a 5mm wall, it jumps to 40–60 seconds.
Mold Open/Close and Ejection
Mold open and close typically takes 2–10 seconds depending on mold size and press tonnage. Small molds on 80–200T presses run 2–4 seconds; large molds on 500–1000T presses take 6–12 seconds. Ejection time adds 0.5–3 seconds, with automated pickers being faster than manual removal.
Putting It All Together
Here’s a sample calculation for a mid-size ABS housing (3mm wall, 80g, 4-cavity mold on a 200T press): t_inject ≈ 1.5s, t_pack ≈ 3s, t_cool ≈ 20s, t_open + t_eject + t_close ≈ 5s. Total cycle time: approximately 29.5 seconds. In production, we’ve seen cycles range from 5 seconds for thin-wall packaging to over 90 seconds for thick technical parts.
What Are the Four Phases of an Injection Molding Cycle?
The four phases are injection (filling), packing (holding), cooling, and ejection/reset. Each has a distinct role in part quality and cycle efficiency.
Phase 1 — Injection (Filling)
The screw pushes forward, forcing molten plastic through the runner and gate into the cavity. Speed is critical — too slow and the melt freezes before filling; too fast and you get jetting or flash. Injection time is typically the shortest phase, but it sets the foundation for part quality.
Phase 2 — Packing (Holding)
Once the cavity is volumetrically full, the machine switches to holding pressure. This extra pressure packs in additional material to compensate for thermal shrinkage as the part cools. Packing continues until the gate freezes off, sealing the cavity. Getting packing time wrong is a common source of sink marks and voids.
Phase 3 — Cooling
The mold maintains a controlled temperature (usually 20–80°C depending on material), pulling heat out of the part until it’s rigid enough to eject without deformation. This phase runs the longest — often 60–70% of total cycle time. Meanwhile, the screw retracts and plasticizes the next shot, so cooling and screw recovery overlap.
Phase 4 — Ejection and Reset
The mold opens, the part is ejected (mechanically or by robot), and the mold closes for the next shot. Ejection can be a bottleneck if parts stick or if manual inspection is required. Well-designed ejector systems and proper draft angles keep this phase predictable.
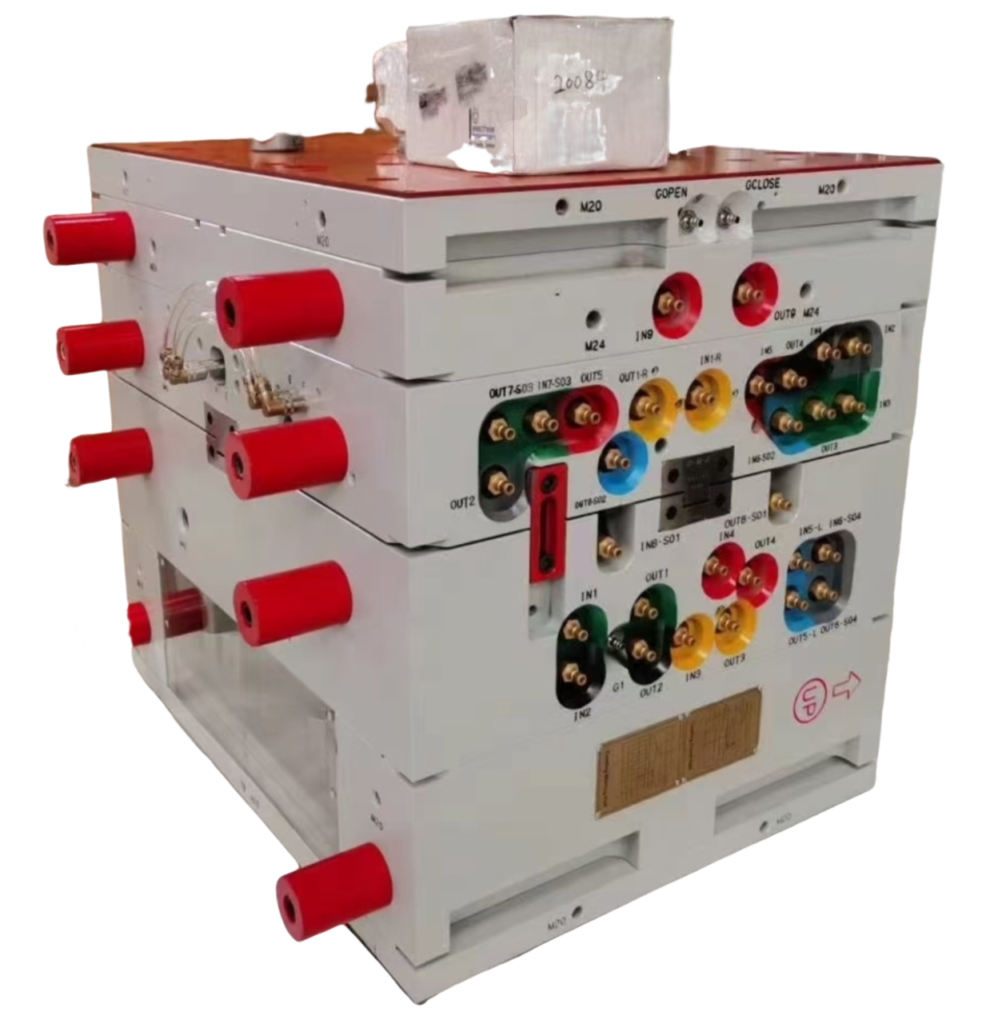
In our Shanghai factory, we run 47 injection molding machines from 90T to 1850T. With over 20 years of production experience across more than 400 materials, we’ve optimized cycle times from fast-cycling PP packaging parts at 8 seconds to thick-wall PC components at 60+ seconds. Every machine logs cycle data shot by shot for continuous improvement.
Why Does Cooling Time Dominate the Cycle?
Cooling is the dominant phase, consuming 60–70% of total cycle time because heat extraction from thick polymer walls takes longer than any other step.
The polymer melt enters the cavity at 200–300°C, and you need to pull it down to 40–80°C before it’s safe to eject. The heat transfer rate depends on several factors.
Wall Thickness — The Big One
Cooling time scales roughly with the square of the thickest section. A part that’s 4mm thick needs about 1.8× the cooling time of a 3mm part. This is why DFM reviews always push for minimum uniform wall thickness.
Material Thermal Conductivity
Amorphous materials like PC and ABS cool differently than semi-crystalline ones like PA and POM. Crystalline materials release latent heat during solidification, which adds to cooling time. Material choice isn’t just about part performance — it directly impacts production economics.
Mold Temperature and Cooling Channel Design
Lower mold temperature pulls heat faster, but too cold causes residual stress, warpage, or poor surface finish. Well-placed baffle circuits, heat pipes, or conformal cooling channels can cut cooling time by 20–40% compared to basic drilled channels. This is where mold engineering pays for itself.

The practical implication: if you want to reduce cycle time, attack cooling first. Uniform wall thickness (keep variations under 25%), optimized cooling channel layout, and proper water flow rates give you the biggest returns.
What Factors Impact Cycle Time Most?
The biggest factors are wall thickness, material thermal properties, mold cooling design, and machine capability — roughly in that order.
Part geometry is the top driver. Thicker walls mean exponentially longer cooling. Complex part geometries with deep ribs, bosses, or varying thickness sections create hot spots that force you to extend the whole cycle for the slowest-cooling area.
Material selection matters because different polymers have different thermal properties. PP and PE cool relatively fast. PC, PPSU, and reinforced nylons need more time. If cycle time is critical and performance allows, switching from PC to ABS can cut cooling by 30–40%.
Mold design is where you win or lose. Key factors include cooling channel placement and flow rate, gate type and location, ejection system reliability, and mold material selection. Beryllium copper inserts conduct heat 3–5× faster than steel and are excellent for hot-spot areas. Machine settings give you incremental gains — higher injection velocity, optimized holding profiles, and faster mold open/close speeds all help, but these are fine-tuning compared to design and mold engineering.
“Cooling time typically accounts for 60–70% of the total injection molding cycle time.”真
Correct. Across thousands of production runs in our factory, cooling consistently dominates the cycle. Even on fast-cycling packaging molds, cooling is still the longest single phase.
“Increasing injection speed always reduces total cycle time.”偽
False. Beyond an optimal point, faster injection causes flash, jetting, or air traps that require extended packing and cooling to fix. The net cycle time can actually increase if you push injection speed too far.
How Can You Optimize Cycle Time Without Sacrificing Quality?
Focus on cooling optimization first, then wall thickness reduction, then machine tuning — in that order of impact. Here are the most effective strategies we use in production.
Redesign Cooling Channels
This is the single highest-ROI change. If your mold has basic straight-drilled channels, switching to baffles, bubblers, or spiral channels can reduce cooling time by 15–30%. For high-volume molds, conformal cooling (made possible by metal 3D printing) can achieve 40%+ reductions.
Minimize and Uniformize Wall Thickness
Every 0.5mm reduction in maximum wall thickness can cut cooling time by 10–20%. Keep wall thickness variation under 25% across the part. Work with your design team early — DFM changes are cheap before the mold is cut, expensive after.
Optimize Gate Location and Type
Better gate placement ensures even filling and reduces the need for extended packing time. Hot runner systems with valve gates allow faster cycling because they seal independently of the cooling phase.
Automate Ejection
Robotic pickers or automatic drop systems eliminate the variability of manual part removal. This is especially impactful for cycles under 15 seconds where human response time becomes a bottleneck.
The caveat: any cycle time optimization must be validated with quality data. If you see sink marks, dimensional drift, or warpage after reducing cycle time, you’ve gone too far. Always run a capability study (Cpk) before locking in a new cycle. For guidance on choosing the right manufacturing partner for optimized production, see our 射出成形調達ガイド.
“A 1-second cycle time reduction on a 4-cavity mold running 24/7 can produce over 100,000 additional parts annually.”真
Correct. Reducing a 30-second cycle to 29 seconds increases output by approximately 145,000 parts per year on a 4-cavity mold running continuously. Even small optimizations compound significantly over high-volume production.
“Using higher mold temperature always improves part quality and is worth the cycle time increase.”偽
False. While higher mold temperature can reduce residual stress and improve surface finish, it also extends cooling time and can cause excessive shrinkage. The optimal mold temperature is a balance between quality requirements and cycle efficiency, not a simple ‘hotter is better’ rule.
What Are Typical Cycle Times for Common Materials?
Cycle times vary widely, but here are typical ranges based on real production data for a mid-complexity part with 2–3mm walls. These ranges assume a standard mold with adequate cooling.
| 素材 | Typical Cycle (seconds) | キーノート |
|---|---|---|
| PP(ポリプロピレン) | 8–25 | Fast cooling, low viscosity — ideal for packaging |
| PE(ポリエチレン) | 8–20 | Similar to PP, good flow characteristics |
| ABS | 15–40 | Moderate cooling, versatile engineering plastic |
| PS(ポリスチレン) | 10–25 | Fast freezing but brittle — needs careful ejection |
| PC(ポリカーボネート) | 25–60 | High melt temperature, slow cooling |
| PA6(ナイロン6) | 15–45 | Semi-crystalline, needs thorough cooling |
| PA66(ナイロン66) | 18–50 | Higher crystallinity than PA6, longer cooling |
| POM (Acetal) | 15–35 | Good thermal properties, fast crystallization |
| TPU | 20–45 | Flexible material, slower ejection required |
| PBT | 15–35 | Fast crystallization, good for electrical parts |
With optimized conformal cooling channels, you can often run 20–30% faster than these ranges. The takeaway: material choice isn’t just about part performance — it directly impacts your production economics through cycle time.
How Do You Measure and Monitor Cycle Time in Production?
Cycle time measurement is performed by the machine’s built-in timer, then tracked with SPC software to catch process drift early.
マシンレベルモニタリング
すべての最新プレスはリアルタイムのサイクルタイムを表示します。ほとんどの機械はサイクルごとのデータを記録し、設定された制限を超えたサイクルがあった場合にオペレーターに警告できます。これが最初の防御ラインです — 機械が32秒を示し、30秒の目標を設定している場合、何か注意が必要です。
SPCトレンド分析とドリフト検出
数百または数千ショットにわたるサイクルタイムを追跡します。徐々に上昇する傾向は、冷却チャネルの汚れ、エジェクターピンの摩耗、材料粘度の変化など、進行中の問題を示すことが多いです。早期に発見することで、品質問題や計画外のダウンタイムを防ぎます。
サイクルタイム変動の一般的な原因
一般的な要因には、冷却水路のスケール堆積(熱伝達低下)、摩耗したホットランナーノズル(充填遅延・保圧延長)、材料のロット間差異、古い機械の油圧システム劣化、季節による環境温度変化などが挙げられます。
当社の推奨:最適化されたサイクルタイムより5%高いサイクルタイムの上方管理限界(UCL)を設定してください。UCLを超えるショットは調査をトリガーする必要があります。この単純なルールにより、不良品が発生する前に進行中の問題の80%を捕捉できます。本格的な運用では、MES(製造実行システム)がサイクルタイムデータと品質検査結果を統合し、サイクルの変動と部品品質をリアルタイムで相関付けることができます。
よくある質問
射出成形サイクルタイムの公式は何ですか?
基本式は、t_cycle = t_inject + t_pack + t_cool + t_open + t_eject + t_closeです。ただし、一部の工程は重複します――特に冷却とスクリュー回復です。両方を加算するのではなく、長い方の時間を採用します。簡易見積もりでは、冷却時間は通常全体の60–70%を占めるため、冷却時間を計測し1.4–1.6を乗算することで妥当な概算値が得られます。実際のサイクル時間は製品形状、材料、金型設計に依存するため、常に実機データで検証してください。
典型的な射出成形サイクルは何秒ですか?
射出成形サイクルは通常10〜60秒の範囲に収まります。ボトルキャップのような薄肉包装部品は、最適化された高速機では5〜8秒でサイクルできます。2〜3mm肉厚の標準的な技術部品は、従来型プレスでは通常15〜30秒で成形されます。厚肉部品やポリカーボネートのような高性能材料は、冷却時間の延長により45〜90秒まで長引くことがあります。具体的なサイクル時間は、肉厚、材料の熱的特性、金型冷却能力、部品の複雑さに大きく依存します。60秒を超えて常時稼働している場合は、冷却の最適化を検討してください。
射出成形における最も長い工程は何ですか?
冷却はほとんどの生産シナリオでほぼ常に最も長いフェーズであり、総サイクルタイムの60〜70%を消費します。これは、溶融ポリマーから十分な熱を抽出し、変形なく排出できるほど部品を剛性化する必要があるためです。熱力学は避けられません:冷却時間はおおよそ肉厚の2乗に比例して増加し、部品の厚さがわずかに増加しても総サイクルが劇的に延長されることを意味します。薄肉包装部品では、射出時間が重要になる場合もありますが、ほとんどの生産において冷却時間が支配的です。
壁の厚さはサイクルタイムにどのように影響しますか?
肉厚はサイクルタイムの最大の要因です。なぜなら、冷却時間はおおよそ肉厚の2乗に比例して増加するからです。肉厚が2倍になると、必要な冷却時間は約4倍になります。例えば、肉厚2mmの部品は8秒の冷却が必要かもしれませんが、同じ形状で4mmの場合、25〜30秒が必要です。この指数関数的関係のため、製造性を考慮した設計レビューでは常に最小で均一な肉厚が求められます。他の部分よりも著しく厚い部分は、全体のサイクルのボトルネックとなり、すべてのキャビティで冷却時間を延長することを強います。
金型を変更せずにサイクルタイムを短縮できますか?
はい、金型変更なしでサイクルタイムを短縮できますが、金型レベルの改造に比べると効果は限定的です。機械側の最適化には、射出速度の向上、保圧プロファイルの調整、最適な冷却水流量・温度の確保、高速サイクル対応材料グレードへの切替えなどがあります。これらの調整では通常、サイクルタイムの5〜15%改善が得られます。20〜40%以上の大幅な改善には、一般に冷却水路の改良、高温箇所へのベリリウム銅インサートの挿入、効率的な充填のためのゲート再設計などの金型改造が必要です。
射出成形におけるサイクルタイムとリードタイムの違いは何ですか?
サイクルタイムは生産速度を測定します — ショットから次のショットまでの1機械サイクルの時間です。リードタイムは、金型製作、材料調達、生産スケジューリング、品質検査、出荷を含む、注文から納品までの総時間です。20秒のサイクルタイムの部品でも、新規金型の場合のリードタイムは4〜6週間、繰り返し生産の場合は3〜5日かかることがあります。両方の指標を理解することはプロジェクト計画に不可欠です — 金型が準備できていなければ、速いサイクルタイムも意味がありません。
射出成形における冷却時間はどのように計算しますか?
簡略化された冷却時間の推定には、t_cool = (肉厚の2乗 × 熱係数) ÷ 熱拡散率 の式を使用します。ここで熱係数は、溶融温度と金型温度の温度差に依存します。実際には、ほとんどのエンジニアは経験的な生産データやMoldflowなどの金型シミュレーションソフトウェアに依存しています。なぜなら、実際の部品形状は正確な手計算には複雑すぎるからです。実用的な経験則として、ABSのような非晶性材料で肉厚3mmの場合、15〜25秒を予想してください。同じ肉厚の半結晶性ナイロンの場合は、冷却時間を20〜30%追加してください。
なぜサイクルタイムはショットごとに変動するのですか?
±0.5〜1秒程度のわずかなサイクルタイムの変動は完全に正常であり、材料供給の一貫性のわずかな違い、スクリュー位置の再現性、油圧システムの応答のわずかな違いに起因します。2秒を超える大きな変動は通常、実際の問題を示しています:材料乾燥の不均一、冷却チャネルの詰まりやスケール、ショットサイズ変動を引き起こす摩耗したチェックリング、または故障した温度センサーなどです。数百ショットにわたって徐々に上昇する傾向を観察した場合は、まず冷却水の流量を確認してください。チャネル内部のミネラルスケールの蓄積が、サイクルタイムのゆっくりとした変動の最も一般的な原因です。
射出成形サイクルタイムを最適化する準備はできていますか?
ZetarMoldのエンジニアリングチームは、400以上の材料にわたる生産サイクルの最適化において20年以上の経験を持っています。詳細な能力概要については、当社の complete guide to injection molding金型設計レビューから生産調整まで、品質を損なうことなく最速のサイクルを達成できるよう支援します。次のプロジェクトの無料見積もりをリクエストしてください。